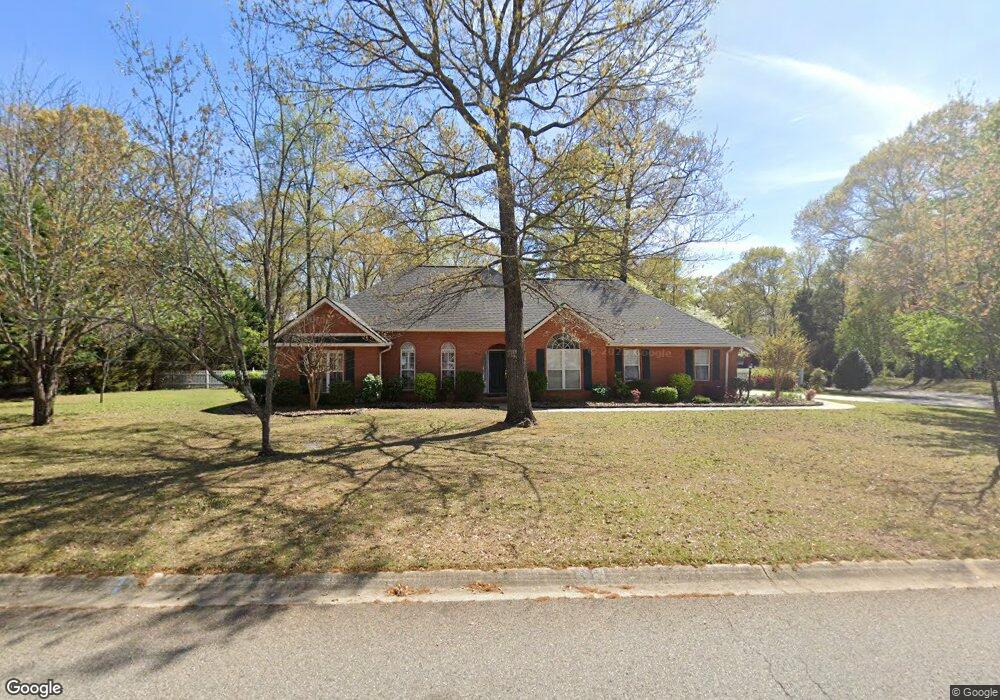
411 Sleepy Ln Warner Robins, GA 31088
Estimated Value: $264,000 - $285,000
3
Beds
2
Baths
1,810
Sq Ft
$154/Sq Ft
Est. Value
About This Home
This home is located at 411 Sleepy Ln, Warner Robins, GA 31088 and is currently estimated at $277,969, approximately $153 per square foot. 411 Sleepy Ln is a home located in Houston County with nearby schools including Lake Joy Primary School, Lake Joy Elementary School, and Mossy Creek Middle School.
Ownership History
Date
Name
Owned For
Owner Type
Purchase Details
Closed on
Aug 29, 2025
Sold by
Bowles Charles Simpson
Bought by
Bridges Rory Keith and Barrett Sarah A
Current Estimated Value
Home Financials for this Owner
Home Financials are based on the most recent Mortgage that was taken out on this home.
Original Mortgage
$281,801
Outstanding Balance
$281,801
Interest Rate
6.74%
Mortgage Type
FHA
Estimated Equity
-$3,832
Purchase Details
Closed on
Apr 21, 2025
Sold by
Bowles Martha Ann
Bought by
Bowles Charles Simpson
Purchase Details
Closed on
Feb 14, 2001
Sold by
Ncw Inc
Bought by
Bowles Charles and Bowles Martha W
Purchase Details
Closed on
Jul 27, 2000
Sold by
Pioneer Holdings & Development Inc
Bought by
Ncw Inc
Create a Home Valuation Report for This Property
The Home Valuation Report is an in-depth analysis detailing your home's value as well as a comparison with similar homes in the area
Home Values in the Area
Average Home Value in this Area
Purchase History
| Date | Buyer | Sale Price | Title Company |
|---|---|---|---|
| Bridges Rory Keith | $297,500 | None Listed On Document | |
| Bowles Charles Simpson | -- | None Listed On Document | |
| Bowles Charles Simpson | -- | None Listed On Document | |
| Bowles Charles Simpson | -- | None Listed On Document | |
| Bowles Charles Simpson | -- | None Listed On Document | |
| Bowles Charles | $142,900 | -- | |
| Ncw Inc | $18,500 | -- |
Source: Public Records
Mortgage History
| Date | Status | Borrower | Loan Amount |
|---|---|---|---|
| Open | Bowles Charles Simpson | $281,801 | |
| Closed | Bowles Charles Simpson | $0 |
Source: Public Records
Tax History Compared to Growth
Tax History
| Year | Tax Paid | Tax Assessment Tax Assessment Total Assessment is a certain percentage of the fair market value that is determined by local assessors to be the total taxable value of land and additions on the property. | Land | Improvement |
|---|---|---|---|---|
| 2024 | $1,800 | $84,360 | $10,800 | $73,560 |
| 2023 | $1,566 | $73,880 | $10,800 | $63,080 |
| 2022 | $1,521 | $72,000 | $10,800 | $61,200 |
| 2021 | $1,350 | $64,640 | $10,800 | $53,840 |
| 2020 | $1,310 | $62,760 | $8,400 | $54,360 |
| 2019 | $1,310 | $62,760 | $8,400 | $54,360 |
| 2018 | $1,310 | $62,760 | $8,400 | $54,360 |
| 2017 | $1,311 | $62,760 | $8,400 | $54,360 |
| 2016 | $1,304 | $62,400 | $8,400 | $54,000 |
| 2015 | $1,304 | $62,400 | $8,400 | $54,000 |
| 2014 | -- | $62,400 | $8,400 | $54,000 |
| 2013 | -- | $62,400 | $8,400 | $54,000 |
Source: Public Records
Map
Nearby Homes