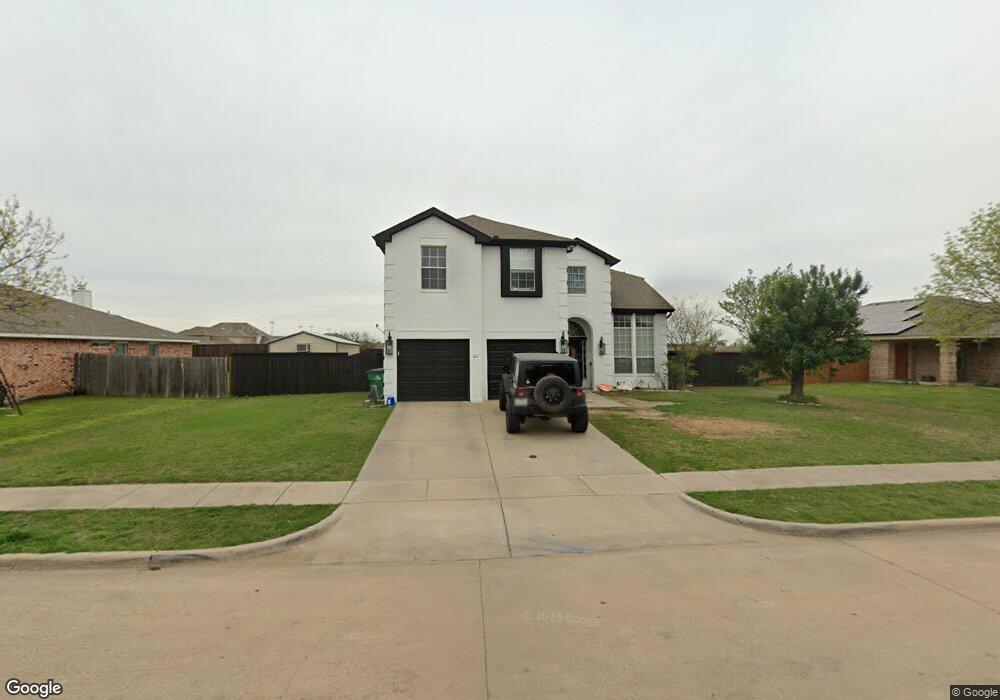
411 Stefhanie Dr Celina, TX 75009
Estimated Value: $448,000 - $479,000
4
Beds
3
Baths
2,166
Sq Ft
$213/Sq Ft
Est. Value
About This Home
This home is located at 411 Stefhanie Dr, Celina, TX 75009 and is currently estimated at $462,186, approximately $213 per square foot. 411 Stefhanie Dr is a home located in Collin County with nearby schools including Celina Primary School, Marcy B. Lykins Elementary School, and Moore Middle School.
Ownership History
Date
Name
Owned For
Owner Type
Purchase Details
Closed on
Sep 20, 2008
Sold by
Everson Kent and Everson Darlene
Bought by
Cook Robert and Cook Julie
Current Estimated Value
Home Financials for this Owner
Home Financials are based on the most recent Mortgage that was taken out on this home.
Original Mortgage
$170,736
Outstanding Balance
$113,835
Interest Rate
6.57%
Mortgage Type
FHA
Estimated Equity
$348,351
Purchase Details
Closed on
Nov 8, 2006
Sold by
Martin Mark Jarrod and Martin Heather R
Bought by
Cook Robert and Cook Julie
Home Financials for this Owner
Home Financials are based on the most recent Mortgage that was taken out on this home.
Original Mortgage
$125,600
Interest Rate
7.9%
Mortgage Type
Purchase Money Mortgage
Purchase Details
Closed on
Nov 30, 2001
Sold by
Choice Homes Inc
Bought by
Martin Mark Jarrod and Martin Heather R
Home Financials for this Owner
Home Financials are based on the most recent Mortgage that was taken out on this home.
Original Mortgage
$151,835
Interest Rate
6.59%
Create a Home Valuation Report for This Property
The Home Valuation Report is an in-depth analysis detailing your home's value as well as a comparison with similar homes in the area
Home Values in the Area
Average Home Value in this Area
Purchase History
| Date | Buyer | Sale Price | Title Company |
|---|---|---|---|
| Cook Robert | -- | Richmond Title Services Lp | |
| Cook Robert | -- | None Available | |
| Martin Mark Jarrod | -- | -- |
Source: Public Records
Mortgage History
| Date | Status | Borrower | Loan Amount |
|---|---|---|---|
| Open | Cook Robert | $170,736 | |
| Previous Owner | Cook Robert | $125,600 | |
| Previous Owner | Martin Mark Jarrod | $151,835 |
Source: Public Records
Tax History Compared to Growth
Tax History
| Year | Tax Paid | Tax Assessment Tax Assessment Total Assessment is a certain percentage of the fair market value that is determined by local assessors to be the total taxable value of land and additions on the property. | Land | Improvement |
|---|---|---|---|---|
| 2025 | $7,455 | $425,584 | $150,000 | $275,584 |
| 2024 | $7,455 | $426,132 | $150,000 | $298,660 |
| 2023 | $7,455 | $387,393 | $120,000 | $288,017 |
| 2022 | $8,072 | $352,175 | $90,000 | $279,905 |
| 2021 | $7,476 | $320,159 | $65,000 | $255,159 |
| 2020 | $7,399 | $303,232 | $65,000 | $238,232 |
| 2019 | $6,993 | $274,539 | $55,000 | $257,991 |
| 2018 | $6,382 | $249,581 | $55,000 | $235,617 |
| 2017 | $5,080 | $242,115 | $45,000 | $197,115 |
| 2016 | $4,650 | $205,355 | $45,000 | $160,355 |
| 2015 | $3,620 | $174,909 | $35,000 | $139,909 |
Source: Public Records
Map
Nearby Homes
- 610 Cork Dr
- 910 W Bois d Arc St
- 516 S Alabama St
- 413 Yellowstone Dr
- 931 W Cedar St
- 611 W Ash St
- 715 W Main St
- 716 W Main St
- 611 W Sycamore St
- 607 W Ash St
- 850 Mellanie Ct
- 528 S Alabama Dr
- 557 S Utah Dr
- 713 W Pecan St
- 509 W Ash St
- 614 S Georgia St
- 309 S Arizona Dr
- 514 S Arizona Dr
- 602 W Pecan St
- 621 Cork Dr
- 431 Stefhanie Dr
- 351 Stefhanie Dr
- 410 Stefhanie Dr
- 451 Stefhanie Dr
- 331 Stefhanie Dr
- 370 Stefhanie Dr
- 430 Stefhanie Dr
- 1101 Ash St
- 350 Stefhanie Dr
- 450 Stefhanie Dr
- 1105 W Ash St
- 311 Stefhanie Dr
- 471 Stefhanie Dr
- 1109 Ash St
- 411 Tolleson Dr
- 371 Tolleson Dr
- 330 Stefhanie Dr
- 431 Tolleson Dr
- 1113 W Ash St
- 470 Stefhanie Dr