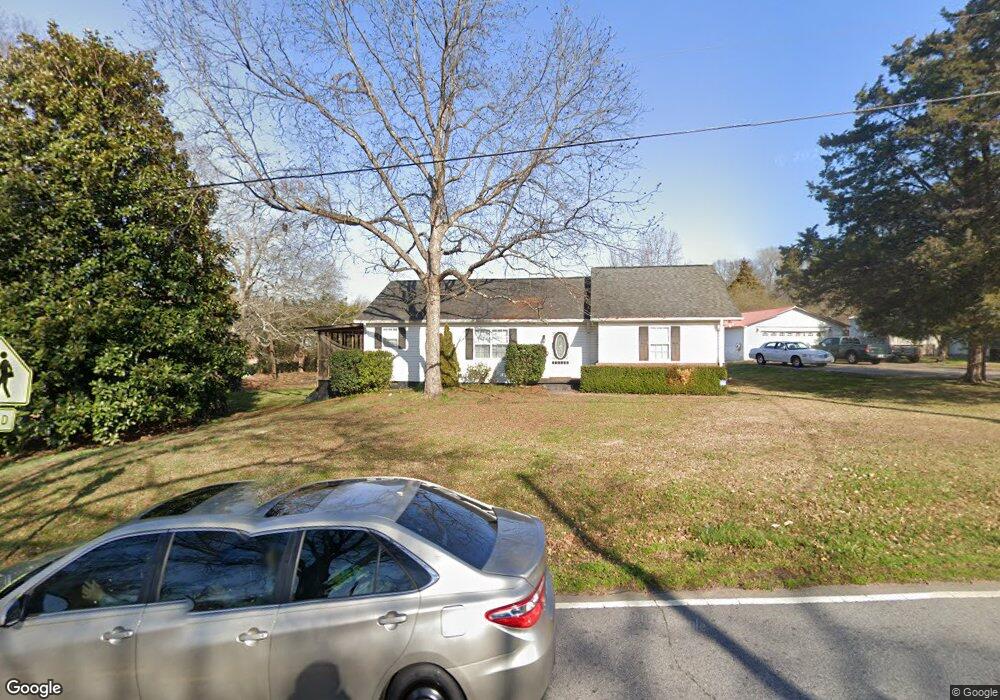
411 Stokes Rd Simpsonville, SC 29681
Estimated Value: $144,000 - $291,000
3
Beds
2
Baths
1,450
Sq Ft
$164/Sq Ft
Est. Value
About This Home
This home is located at 411 Stokes Rd, Simpsonville, SC 29681 and is currently estimated at $238,189, approximately $164 per square foot. 411 Stokes Rd is a home located in Greenville County with nearby schools including Simpsonville Elementary, Hillcrest Middle School, and Hillcrest High School.
Ownership History
Date
Name
Owned For
Owner Type
Purchase Details
Closed on
Jun 9, 2009
Sold by
Painter Tony and Hagerty Brian
Bought by
Sprague Michael W
Current Estimated Value
Home Financials for this Owner
Home Financials are based on the most recent Mortgage that was taken out on this home.
Original Mortgage
$122,580
Outstanding Balance
$77,448
Interest Rate
4.77%
Mortgage Type
VA
Estimated Equity
$160,741
Purchase Details
Closed on
Dec 29, 2008
Sold by
Painter Tony
Bought by
Hagerty Brian
Purchase Details
Closed on
May 24, 2007
Sold by
Gadbury Paul
Bought by
Hsbc Bank Usa Na and Credit Suisse First Boston Csfb Armt 200
Purchase Details
Closed on
May 22, 2007
Sold by
Hsbc Bank Usa Na
Bought by
Painter Tony
Purchase Details
Closed on
Jul 15, 2004
Sold by
Gadbury Paul
Bought by
Gadbury Paul
Purchase Details
Closed on
Dec 20, 2002
Sold by
Coleman E Robert
Bought by
Gadbury Paul
Create a Home Valuation Report for This Property
The Home Valuation Report is an in-depth analysis detailing your home's value as well as a comparison with similar homes in the area
Home Values in the Area
Average Home Value in this Area
Purchase History
| Date | Buyer | Sale Price | Title Company |
|---|---|---|---|
| Sprague Michael W | $120,000 | -- | |
| Hagerty Brian | -- | -- | |
| Hsbc Bank Usa Na | $63,750 | None Available | |
| Painter Tony | $81,100 | None Available | |
| Gadbury Paul | -- | -- | |
| Gadbury Paul | $77,000 | -- |
Source: Public Records
Mortgage History
| Date | Status | Borrower | Loan Amount |
|---|---|---|---|
| Open | Sprague Michael W | $122,580 |
Source: Public Records
Tax History Compared to Growth
Tax History
| Year | Tax Paid | Tax Assessment Tax Assessment Total Assessment is a certain percentage of the fair market value that is determined by local assessors to be the total taxable value of land and additions on the property. | Land | Improvement |
|---|---|---|---|---|
| 2024 | $910 | $4,010 | $1,390 | $2,620 |
| 2023 | $910 | $4,010 | $1,390 | $2,620 |
| 2022 | $892 | $4,010 | $1,390 | $2,620 |
| 2021 | $892 | $4,010 | $1,390 | $2,620 |
| 2020 | $848 | $3,490 | $1,000 | $2,490 |
| 2019 | $848 | $3,490 | $1,000 | $2,490 |
| 2018 | $714 | $3,490 | $1,000 | $2,490 |
| 2017 | $714 | $3,490 | $1,000 | $2,490 |
| 2016 | $560 | $87,250 | $25,000 | $62,250 |
| 2015 | $561 | $87,250 | $25,000 | $62,250 |
| 2014 | $627 | $103,230 | $25,000 | $78,230 |
Source: Public Records
Map
Nearby Homes
- 112 Cameron Creek Ln
- 27 Farmbrook Way
- 240 Applehill Way
- 205 Newgate Dr
- 146 Stokes Rd
- 301 Blant Ct
- 4 Cloverdale Ct
- 205 Tamora Ct
- 15 Knights Valley Dr
- 131 Wilbon Cir
- 502 Kingsmoor Dr
- 00 Jonesville Rd
- 6 Worthington Ct
- 528 Kingsmoor Dr
- 2 Pembark Ln
- 212 Forest Park Dr
- 108 Acacia Dr
- 311 Oxner Rd
- 102 Terrace Cir
- 110 Scarsdale St
- 412 Stokes Rd
- Lot 24 Powdermill
- 417 Stokes Rd
- 404 Stokes Rd
- 608 Powdermill Dr
- 410 Stokes Rd
- 604 Powdermill Dr
- 6 Cameron Creek Ln
- 402 Stokes Rd
- 23 Kennel Ct
- 24 Kennel Ct
- 600 Powdermill Dr
- 600 Powdermill Dr
- 109 Beaverdale Ct
- 111 Beaverdale Ct
- 605 Powdermill Dr
- 604 Brookmere Rd
- 25 Kennel Ct
- 421 Stokes Rd
- 107 Beaverdale Ct