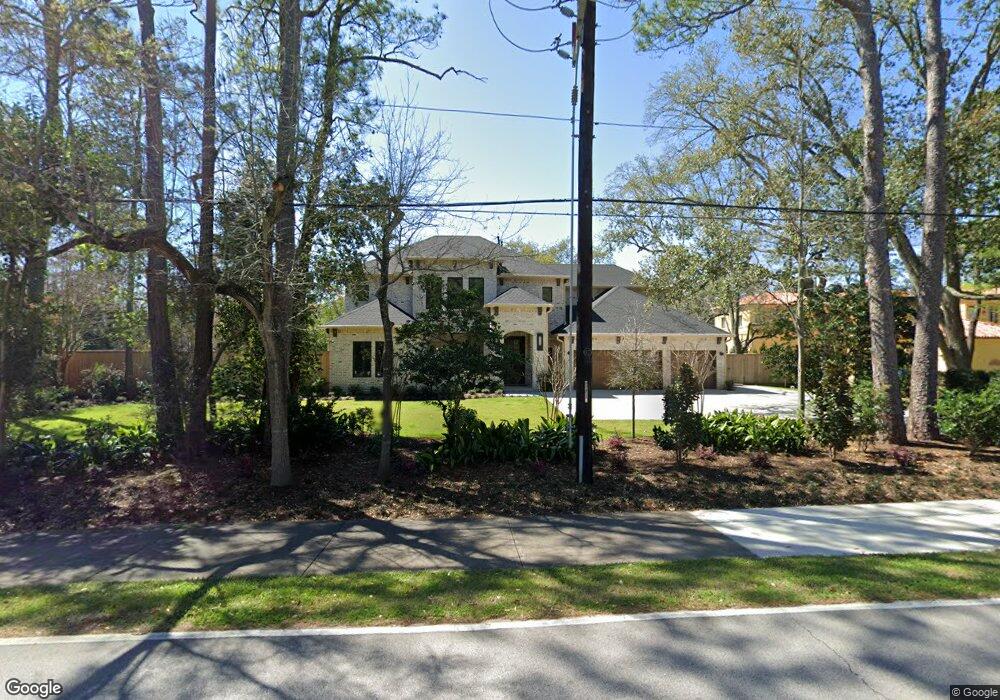
411 Strey Ln Houston, TX 77024
Estimated Value: $2,330,000 - $2,479,000
5
Beds
5
Baths
4,194
Sq Ft
$575/Sq Ft
Est. Value
About This Home
This home is located at 411 Strey Ln, Houston, TX 77024 and is currently estimated at $2,411,142, approximately $574 per square foot. 411 Strey Ln is a home located in Harris County with nearby schools including Frostwood Elementary School, Memorial Middle, and Memorial High School.
Ownership History
Date
Name
Owned For
Owner Type
Purchase Details
Closed on
Jun 15, 2012
Sold by
Riner Wade A and Riner Tonya B
Bought by
Adams John C and Allen Kathryn P
Current Estimated Value
Home Financials for this Owner
Home Financials are based on the most recent Mortgage that was taken out on this home.
Original Mortgage
$105,000
Outstanding Balance
$14,826
Interest Rate
3.8%
Mortgage Type
Stand Alone Second
Estimated Equity
$2,396,316
Purchase Details
Closed on
Sep 13, 2001
Sold by
Liberty Svgs Bank Fsb
Bought by
Riner Wade A and Riner Tonya D
Home Financials for this Owner
Home Financials are based on the most recent Mortgage that was taken out on this home.
Original Mortgage
$540,000
Interest Rate
6.96%
Purchase Details
Closed on
Dec 5, 2000
Sold by
Harsh George W and Harsh Janice B
Bought by
Liberty Svgs Bank Fsb
Create a Home Valuation Report for This Property
The Home Valuation Report is an in-depth analysis detailing your home's value as well as a comparison with similar homes in the area
Home Values in the Area
Average Home Value in this Area
Purchase History
| Date | Buyer | Sale Price | Title Company |
|---|---|---|---|
| Adams John C | -- | Old Republic National Title | |
| Adams John C | -- | Old Republic National Title | |
| Riner Wade A | -- | Alamo Title Company | |
| Liberty Svgs Bank Fsb | $400,000 | -- |
Source: Public Records
Mortgage History
| Date | Status | Borrower | Loan Amount |
|---|---|---|---|
| Open | Adams John C | $105,000 | |
| Closed | Adams John C | $105,000 | |
| Open | Adams John C | $417,000 | |
| Closed | Adams John C | $417,000 | |
| Previous Owner | Riner Wade A | $540,000 |
Source: Public Records
Tax History Compared to Growth
Tax History
| Year | Tax Paid | Tax Assessment Tax Assessment Total Assessment is a certain percentage of the fair market value that is determined by local assessors to be the total taxable value of land and additions on the property. | Land | Improvement |
|---|---|---|---|---|
| 2025 | $28,138 | $2,182,310 | $1,102,491 | $1,079,819 |
| 2024 | $28,138 | $1,804,402 | $1,065,741 | $738,661 |
| 2023 | $28,138 | $2,282,674 | $1,010,617 | $1,272,057 |
| 2022 | $40,026 | $2,391,300 | $1,010,617 | $1,380,683 |
| 2021 | $42,518 | $1,963,300 | $955,492 | $1,007,808 |
| 2020 | $33,885 | $1,530,000 | $955,492 | $574,508 |
| 2019 | $35,251 | $1,528,206 | $955,492 | $572,714 |
| 2018 | $7,912 | $1,557,000 | $955,492 | $601,508 |
| 2017 | $35,849 | $1,609,700 | $955,492 | $654,208 |
| 2016 | $32,590 | $1,677,219 | $955,492 | $721,727 |
| 2015 | $22,060 | $1,677,219 | $955,492 | $721,727 |
| 2014 | $22,060 | $1,200,000 | $826,868 | $373,132 |
Source: Public Records
Map
Nearby Homes
- 12003 Tall Oaks St
- 345 Knipp Rd
- 234 Plantation Rd
- 318 Knipp Rd
- 601 Strey Ln
- 11910 Heritage Ln
- 170 Haversham Dr
- 12334 Beauregard Dr
- 0 Gessner Rd
- 150 Gessner Rd Unit 5A
- 12327 Tunbridge Ln
- 354 Tealwood Dr
- 358 Tealwood Dr
- 201 Vanderpool Ln Unit 103
- 201 Vanderpool Ln Unit 65
- 201 Vanderpool Ln Unit 64
- 12222 Broken Bough Dr
- 12326 Old Oaks Dr
- 11722 Claywood St
- 11718 Broken Bough Cir
- 415 Strey Ln
- 402 Wolf Ct
- 11935 Arbordale Ln
- 11934 Arbordale Ln
- 7 Norvell Ct
- 406 Wolf Ct
- 8 Norvell Ct
- 12007 Winwood Ln
- 11918 Steppingstone Ln
- 11935 Winwood Ln
- 11611 Wolf Ct
- 12011 Winwood Ln
- 6 Norvell Ct
- 11931 Arbordale Ln
- 11930 Arbordale Ln
- 11914 Steppingstone Ln
- 403 Wolf Ct
- 407 Wolf Ct
- 11919 Steppingstone Ln
- 12006 Winwood Ln