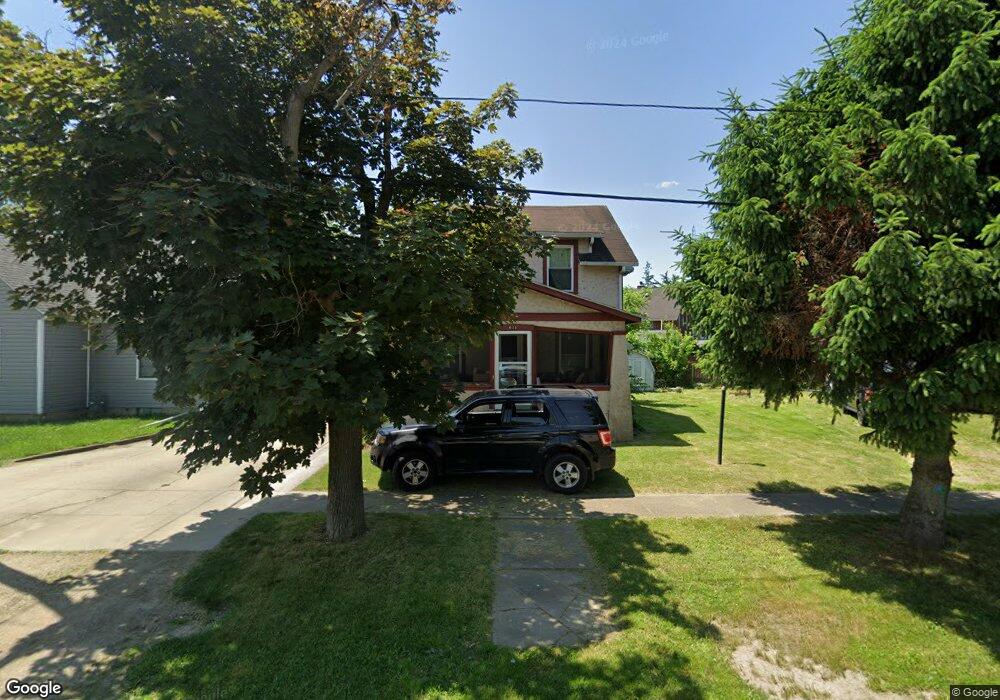
411 Vine St Fremont, OH 43420
Estimated Value: $75,000 - $110,000
3
Beds
1
Bath
921
Sq Ft
$97/Sq Ft
Est. Value
About This Home
This home is located at 411 Vine St, Fremont, OH 43420 and is currently estimated at $89,726, approximately $97 per square foot. 411 Vine St is a home located in Sandusky County with nearby schools including Fremont Ross High School, Bishop Hoffman Catholic School - This is St Joe's School now, and St. Joseph School.
Ownership History
Date
Name
Owned For
Owner Type
Purchase Details
Closed on
Aug 26, 2021
Sold by
Heishman John H and Heishman Susan A
Bought by
Heishman Roy J and Heishman Jim
Current Estimated Value
Purchase Details
Closed on
Oct 6, 2000
Sold by
United Co Lending Corp
Bought by
Heishman John H and Heishman Susan A
Home Financials for this Owner
Home Financials are based on the most recent Mortgage that was taken out on this home.
Original Mortgage
$37,500
Interest Rate
10.75%
Mortgage Type
New Conventional
Purchase Details
Closed on
Jun 14, 2000
Sold by
Bates Herman R
Bought by
United Companies Lending Corp
Purchase Details
Closed on
Jul 27, 1994
Sold by
Michael Douglas A
Bought by
Bates Herman R
Home Financials for this Owner
Home Financials are based on the most recent Mortgage that was taken out on this home.
Original Mortgage
$38,000
Interest Rate
8.41%
Mortgage Type
New Conventional
Purchase Details
Closed on
Aug 1, 1989
Bought by
Heishman John H and Heishman Susan A
Create a Home Valuation Report for This Property
The Home Valuation Report is an in-depth analysis detailing your home's value as well as a comparison with similar homes in the area
Home Values in the Area
Average Home Value in this Area
Purchase History
| Date | Buyer | Sale Price | Title Company |
|---|---|---|---|
| Heishman Roy J | $53,000 | None Available | |
| Heishman John H | $37,500 | -- | |
| United Companies Lending Corp | $38,000 | -- | |
| Bates Herman R | $40,000 | -- | |
| Heishman John H | $34,400 | -- |
Source: Public Records
Mortgage History
| Date | Status | Borrower | Loan Amount |
|---|---|---|---|
| Previous Owner | Heishman John H | $37,500 | |
| Previous Owner | Bates Herman R | $38,000 |
Source: Public Records
Tax History Compared to Growth
Tax History
| Year | Tax Paid | Tax Assessment Tax Assessment Total Assessment is a certain percentage of the fair market value that is determined by local assessors to be the total taxable value of land and additions on the property. | Land | Improvement |
|---|---|---|---|---|
| 2024 | $618 | $18,730 | $3,610 | $15,120 |
| 2023 | $689 | $14,880 | $2,870 | $12,010 |
| 2022 | $576 | $14,880 | $2,870 | $12,010 |
| 2021 | $594 | $14,880 | $2,870 | $12,010 |
| 2020 | $500 | $12,320 | $2,870 | $9,450 |
| 2019 | $499 | $12,320 | $2,870 | $9,450 |
| 2018 | $500 | $12,320 | $2,870 | $9,450 |
| 2017 | $483 | $11,870 | $2,870 | $9,000 |
| 2016 | $424 | $11,870 | $2,870 | $9,000 |
| 2015 | $416 | $11,870 | $2,870 | $9,000 |
| 2014 | $449 | $12,190 | $2,910 | $9,280 |
| 2013 | $439 | $12,190 | $2,910 | $9,280 |
Source: Public Records
Map
Nearby Homes
- 515 S Arch St
- 625 Bush Place
- 619 Hayes Ave
- 616 S Wood St
- 815 South St
- 905 Twinn St
- 1015 Hayes Ave
- 1028 June St
- 1013 Whittlesey St
- 1037 Buckland Ave
- 208 E State St
- 600 S Buchanan St
- 0 S Buchanan St
- 906 Amsden Blvd
- 224 Sandusky Ave Unit 226
- 216 S Buchanan St
- 427 N Clover St
- 1009 Napoleon St
- 714 E State St
- 1342 Mcpherson Blvd