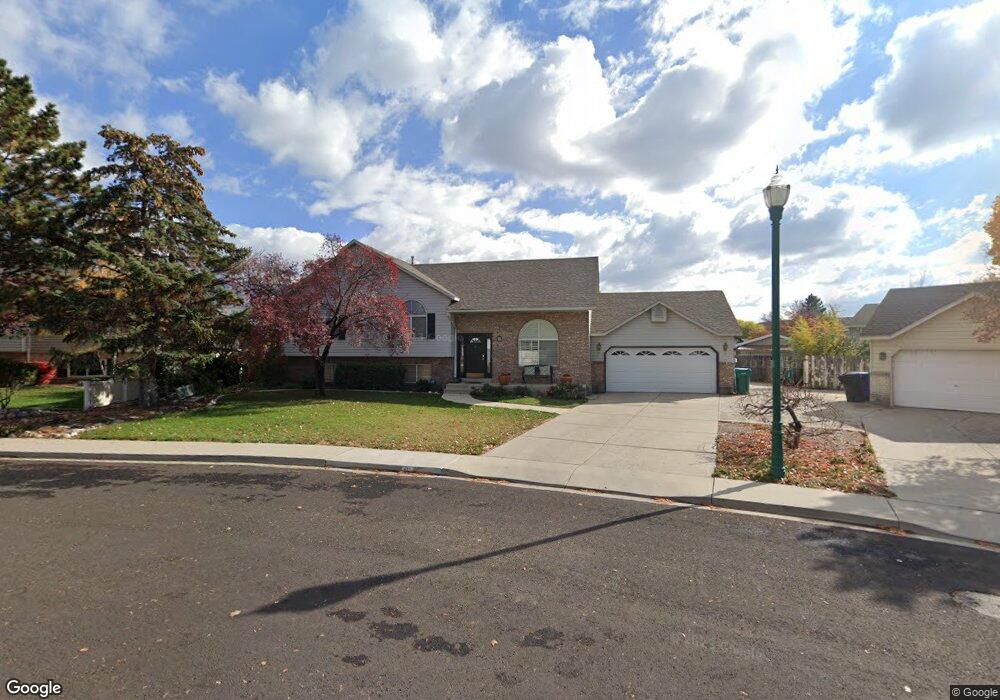
411 W 1010 N Orem, UT 84057
Bonneville NeighborhoodEstimated Value: $594,312 - $609,000
3
Beds
3
Baths
2,892
Sq Ft
$208/Sq Ft
Est. Value
About This Home
This home is located at 411 W 1010 N, Orem, UT 84057 and is currently estimated at $600,771, approximately $207 per square foot. 411 W 1010 N is a home located in Utah County with nearby schools including Bonneville Elementary School, Orem Junior High School, and Timpanogos High School.
Ownership History
Date
Name
Owned For
Owner Type
Purchase Details
Closed on
May 24, 2021
Sold by
Thompson Raymond
Bought by
Thompson Raymond and Thompson Raymond Bennett
Current Estimated Value
Purchase Details
Closed on
Jan 8, 2021
Sold by
Thompson Raymond
Bought by
Thompson Raymond and Thompson Raymond Bennett
Home Financials for this Owner
Home Financials are based on the most recent Mortgage that was taken out on this home.
Original Mortgage
$235,700
Outstanding Balance
$210,326
Interest Rate
2.7%
Mortgage Type
New Conventional
Estimated Equity
$390,445
Purchase Details
Closed on
Jan 7, 2021
Sold by
Thompson Raymond
Bought by
Thompson Raymond
Home Financials for this Owner
Home Financials are based on the most recent Mortgage that was taken out on this home.
Original Mortgage
$235,700
Outstanding Balance
$210,326
Interest Rate
2.7%
Mortgage Type
New Conventional
Estimated Equity
$390,445
Purchase Details
Closed on
Apr 3, 2017
Sold by
Cranford Ventures Llc
Bought by
Thompson Raymond
Home Financials for this Owner
Home Financials are based on the most recent Mortgage that was taken out on this home.
Original Mortgage
$245,300
Interest Rate
4.16%
Mortgage Type
New Conventional
Purchase Details
Closed on
Mar 30, 2015
Sold by
Caranford Garland
Bought by
Caranford Ventures Llc
Home Financials for this Owner
Home Financials are based on the most recent Mortgage that was taken out on this home.
Original Mortgage
$176,000
Interest Rate
3.65%
Mortgage Type
New Conventional
Purchase Details
Closed on
Mar 25, 2015
Sold by
Herrick Joe and Herrick Arlene
Bought by
Cranford Garland
Home Financials for this Owner
Home Financials are based on the most recent Mortgage that was taken out on this home.
Original Mortgage
$176,000
Interest Rate
3.65%
Mortgage Type
New Conventional
Purchase Details
Closed on
Jan 9, 2012
Sold by
Herrick Joe
Bought by
Herrick Joe and Herrick Arlene
Purchase Details
Closed on
Jul 6, 2001
Sold by
Ercanbrack Jeffrey T and Ercanbrack Judy S
Bought by
Herrick Joe
Home Financials for this Owner
Home Financials are based on the most recent Mortgage that was taken out on this home.
Original Mortgage
$148,000
Interest Rate
7.24%
Mortgage Type
Seller Take Back
Create a Home Valuation Report for This Property
The Home Valuation Report is an in-depth analysis detailing your home's value as well as a comparison with similar homes in the area
Home Values in the Area
Average Home Value in this Area
Purchase History
| Date | Buyer | Sale Price | Title Company |
|---|---|---|---|
| Thompson Raymond | -- | Stewart Title Ins Agcy Of Ut | |
| Thompson Raymond | -- | Stewart Title Ins Agcy Of Ut | |
| Thompson Raymond | -- | None Available | |
| Thompson Raymond | -- | Stewart Title Ins Agcy Of Ut | |
| Thompson Raymond | -- | 1St Liberty Title Lc | |
| Caranford Ventures Llc | -- | 1St Liberty Title Lc | |
| Cranford Garland | -- | Select Title Ins Agency | |
| Herrick Joe | -- | Utah First Title Insurance A | |
| Herrick Joe | -- | Empire Land Title Company |
Source: Public Records
Mortgage History
| Date | Status | Borrower | Loan Amount |
|---|---|---|---|
| Open | Thompson Raymond | $235,700 | |
| Closed | Thompson Raymond | $245,300 | |
| Previous Owner | Cranford Garland | $176,000 | |
| Previous Owner | Herrick Joe | $148,000 |
Source: Public Records
Tax History
| Year | Tax Paid | Tax Assessment Tax Assessment Total Assessment is a certain percentage of the fair market value that is determined by local assessors to be the total taxable value of land and additions on the property. | Land | Improvement |
|---|---|---|---|---|
| 2025 | $2,286 | $305,030 | -- | -- |
| 2024 | $2,286 | $279,510 | $0 | $0 |
| 2023 | $2,130 | $279,950 | $0 | $0 |
| 2022 | $2,235 | $284,515 | $0 | $0 |
| 2021 | $2,081 | $401,400 | $175,900 | $225,500 |
| 2020 | $1,909 | $361,800 | $140,700 | $221,100 |
| 2019 | $1,761 | $347,000 | $140,700 | $206,300 |
| 2018 | $1,663 | $313,200 | $128,600 | $184,600 |
| 2017 | $1,625 | $163,955 | $0 | $0 |
| 2016 | $1,672 | $155,540 | $0 | $0 |
| 2015 | $1,578 | $138,820 | $0 | $0 |
| 2014 | $1,539 | $134,805 | $0 | $0 |
Source: Public Records
Map
Nearby Homes
- 538 W 1120 N
- 1111 N 150 W
- 1244 N 580 W
- 125 W 870 N
- 582 W 1300 N
- 531 W 1350 N
- 287 W 1380 N
- 332 W Amiron Way Unit D
- 16 E 925 N
- 1123 N 800 W
- 512 W 1450 N
- 597 N State St Unit 25
- 1461 N Amiron Way Unit D
- 1461 N Amiron Way Unit B
- 1545 N State St Unit 1
- 686 N 835 W
- 1405 N 770 W
- 557 N Emery Ave
- 1566 N 275 West St Unit 1
- 917 N Garden Dr
Your Personal Tour Guide
Ask me questions while you tour the home.