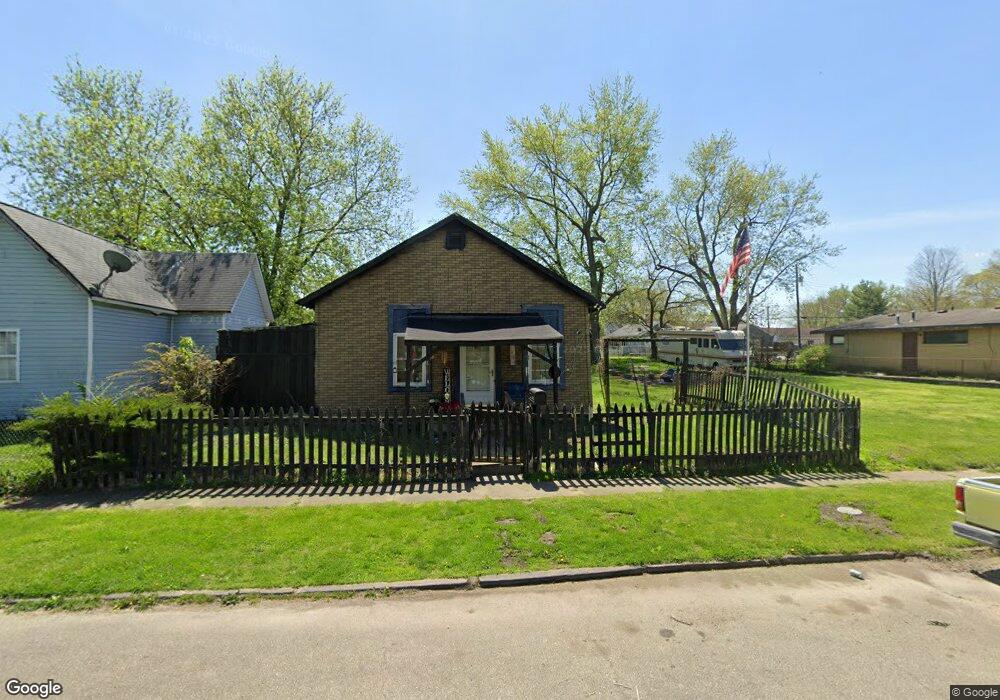
411 W 2nd St Anderson, IN 46016
Estimated Value: $54,557 - $97,000
2
Beds
1
Bath
675
Sq Ft
$107/Sq Ft
Est. Value
About This Home
This home is located at 411 W 2nd St, Anderson, IN 46016 and is currently estimated at $72,389, approximately $107 per square foot. 411 W 2nd St is a home located in Madison County with nearby schools including Eastside Elementary School, Highland Middle School, and Anderson High School.
Ownership History
Date
Name
Owned For
Owner Type
Purchase Details
Closed on
Nov 15, 2013
Sold by
American Equity Funding Inc
Bought by
Keller Karen
Current Estimated Value
Purchase Details
Closed on
Oct 1, 2010
Sold by
Genco Dev Inc
Bought by
American Equity Funding Inc
Purchase Details
Closed on
Oct 5, 2009
Sold by
The Bank Of New York Mellon
Bought by
Genco Development Inc
Purchase Details
Closed on
Aug 14, 2009
Sold by
Solots Shari
Bought by
The Bank Of New York Mellon
Purchase Details
Closed on
Mar 24, 2007
Sold by
Solots Shari
Bought by
Ellet Angela
Create a Home Valuation Report for This Property
The Home Valuation Report is an in-depth analysis detailing your home's value as well as a comparison with similar homes in the area
Home Values in the Area
Average Home Value in this Area
Purchase History
| Date | Buyer | Sale Price | Title Company |
|---|---|---|---|
| Keller Karen | -- | -- | |
| American Equity Funding Inc | -- | -- | |
| Genco Development Inc | -- | -- | |
| The Bank Of New York Mellon | $8,500 | -- | |
| Ellet Angela | -- | -- |
Source: Public Records
Tax History Compared to Growth
Tax History
| Year | Tax Paid | Tax Assessment Tax Assessment Total Assessment is a certain percentage of the fair market value that is determined by local assessors to be the total taxable value of land and additions on the property. | Land | Improvement |
|---|---|---|---|---|
| 2024 | -- | $25,500 | $8,100 | $17,400 |
| 2023 | -- | $23,600 | $7,700 | $15,900 |
| 2022 | $0 | $23,200 | $7,200 | $16,000 |
| 2021 | $0 | $21,800 | $7,200 | $14,600 |
| 2020 | $224 | $20,800 | $6,800 | $14,000 |
| 2019 | $220 | $20,400 | $6,800 | $13,600 |
| 2018 | $210 | $19,200 | $6,800 | $12,400 |
| 2017 | $193 | $19,100 | $6,800 | $12,300 |
| 2016 | $203 | $19,100 | $6,800 | $12,300 |
| 2014 | $194 | $19,200 | $6,900 | $12,300 |
| 2013 | $194 | $19,300 | $6,900 | $12,400 |
Source: Public Records
Map
Nearby Homes