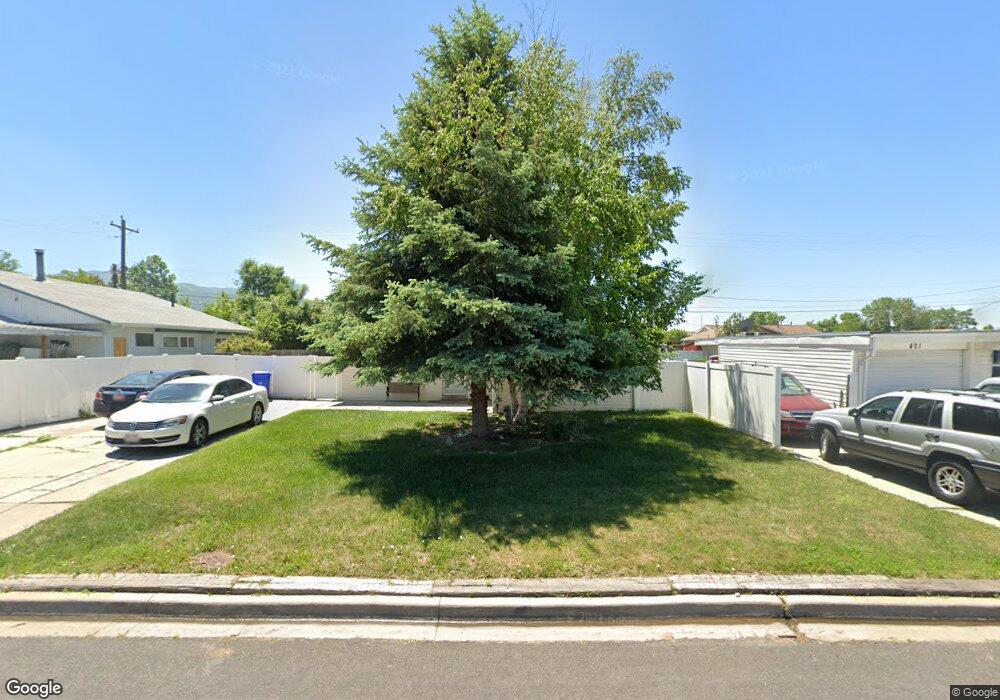
411 W 800 S Bountiful, UT 84010
Estimated Value: $400,000 - $404,000
3
Beds
1
Bath
1,075
Sq Ft
$374/Sq Ft
Est. Value
About This Home
This home is located at 411 W 800 S, Bountiful, UT 84010 and is currently estimated at $401,770, approximately $373 per square foot. 411 W 800 S is a home located in Davis County with nearby schools including Bountiful Elementary School, Millcreek Junior High School, and Bountiful High School.
Ownership History
Date
Name
Owned For
Owner Type
Purchase Details
Closed on
Dec 18, 2002
Sold by
Depasquale Dominic John
Bought by
Dabel Mike and Dabel Charity J
Current Estimated Value
Home Financials for this Owner
Home Financials are based on the most recent Mortgage that was taken out on this home.
Original Mortgage
$117,161
Outstanding Balance
$49,565
Interest Rate
6.03%
Mortgage Type
FHA
Estimated Equity
$352,205
Purchase Details
Closed on
Dec 17, 1998
Sold by
Bingham Jason L and Bingham Cynthia J
Bought by
Depasquale Dominic John
Home Financials for this Owner
Home Financials are based on the most recent Mortgage that was taken out on this home.
Original Mortgage
$106,000
Interest Rate
6.86%
Purchase Details
Closed on
Jan 29, 1996
Sold by
Bingham Jason L and Bingham Cindy J
Bought by
Bingham Jason L and Bingham Cynthia J
Home Financials for this Owner
Home Financials are based on the most recent Mortgage that was taken out on this home.
Original Mortgage
$69,182
Interest Rate
7.14%
Mortgage Type
FHA
Create a Home Valuation Report for This Property
The Home Valuation Report is an in-depth analysis detailing your home's value as well as a comparison with similar homes in the area
Purchase History
| Date | Buyer | Sale Price | Title Company |
|---|---|---|---|
| Dabel Mike | -- | Equity Title Agency | |
| Depasquale Dominic John | -- | Bonneville Title Company Inc | |
| Bingham Jason L | -- | First American Title Co |
Source: Public Records
Mortgage History
| Date | Status | Borrower | Loan Amount |
|---|---|---|---|
| Open | Dabel Mike | $117,161 | |
| Previous Owner | Depasquale Dominic John | $106,000 | |
| Previous Owner | Bingham Jason L | $69,182 |
Source: Public Records
Tax History
| Year | Tax Paid | Tax Assessment Tax Assessment Total Assessment is a certain percentage of the fair market value that is determined by local assessors to be the total taxable value of land and additions on the property. | Land | Improvement |
|---|---|---|---|---|
| 2025 | $2,172 | $195,250 | $115,838 | $79,412 |
| 2024 | $2,015 | $189,199 | $99,029 | $90,170 |
| 2023 | $1,926 | $180,400 | $102,495 | $77,904 |
| 2022 | $2,016 | $343,000 | $187,090 | $155,910 |
| 2021 | $1,861 | $266,000 | $134,487 | $131,513 |
| 2020 | $1,531 | $218,000 | $115,440 | $102,560 |
| 2019 | $1,558 | $217,000 | $132,923 | $84,077 |
| 2018 | $1,427 | $195,000 | $128,327 | $66,673 |
| 2016 | $1,201 | $88,605 | $50,861 | $37,744 |
| 2015 | $1,167 | $81,180 | $50,861 | $30,319 |
| 2014 | $1,271 | $91,906 | $50,861 | $41,045 |
| 2013 | -- | $81,744 | $36,190 | $45,554 |
Source: Public Records
Map
Nearby Homes
- 360 W 800 S
- 1016 S 400 W
- 990 S 500 W
- 553 Clark St
- 109 W 900 S
- 1314 S 200 W Unit 19
- 1350 S 200 W
- 1289 S 675 W
- 650 S Main St Unit 9106
- 650 S Main St Unit 6111
- 758 W 1000 S
- 1602 S 550 W
- 34 W 400 S
- 32 W 400 S
- 680 W 500 S Unit 17
- 75 N Peregrine Ln W Unit 8
- 545 S 100 E
- 1601 S 700 W
- 553 W 1880 S
- 290 N 500 W Unit 305
Your Personal Tour Guide
Ask me questions while you tour the home.