Estimated Value: $128,000 - $234,000
3
Beds
1
Bath
1,686
Sq Ft
$115/Sq Ft
Est. Value
About This Home
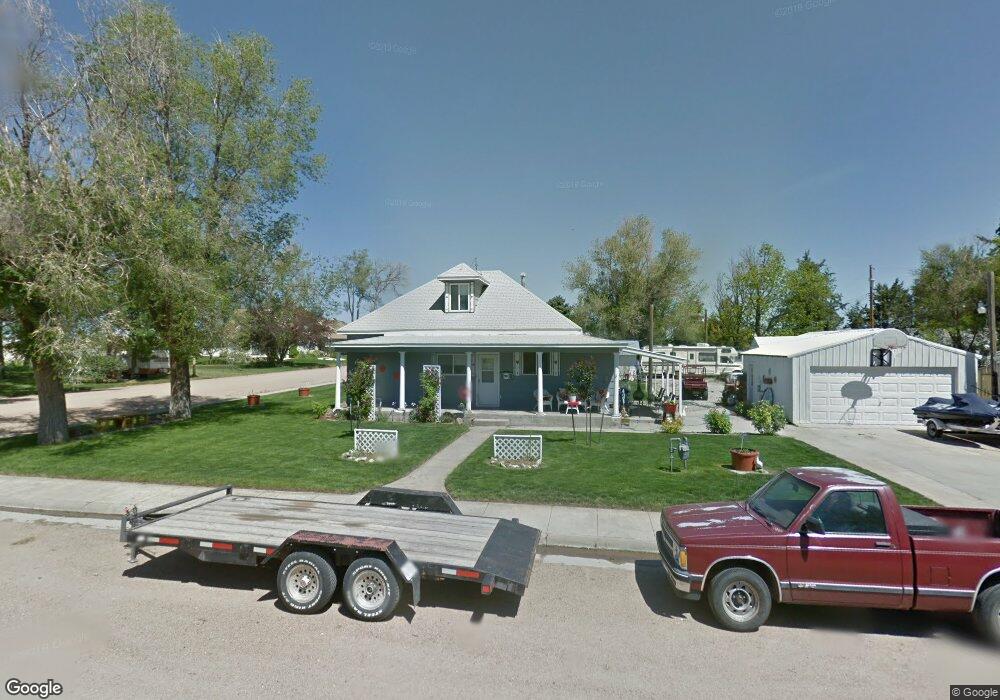
This home is located at 411 W 9th St, Brule, NE 69127 and is currently estimated at $194,302, approximately $115 per square foot. 411 W 9th St is a home with nearby schools including So Platte Elementary at Big Springs and South Platte High School.
Create a Home Valuation Report for This Property
The Home Valuation Report is an in-depth analysis detailing your home's value as well as a comparison with similar homes in the area
Tax History
| Year | Tax Paid | Tax Assessment Tax Assessment Total Assessment is a certain percentage of the fair market value that is determined by local assessors to be the total taxable value of land and additions on the property. | Land | Improvement |
|---|---|---|---|---|
| 2025 | -- | $195,390 | $12,170 | $183,220 |
| 2024 | -- | $153,285 | $12,170 | $141,115 |
| 2023 | $1,472 | $117,600 | $12,170 | $105,430 |
| 2022 | $1,640 | $125,385 | $12,170 | $113,215 |
| 2021 | $1,295 | $94,485 | $10,250 | $84,235 |
| 2020 | $1,419 | $108,450 | $10,250 | $98,200 |
| 2019 | $1,177 | $86,875 | $8,200 | $78,675 |
| 2018 | $1,041 | $73,645 | $7,815 | $65,830 |
| 2017 | $1,120 | $77,175 | $7,315 | $69,860 |
| 2016 | $944 | $61,670 | $7,315 | $54,355 |
| 2015 | $865 | $52,710 | $6,250 | $46,460 |
| 2010 | -- | $58,450 | $6,250 | $52,200 |
Source: Public Records
Map
Nearby Homes
- 714 Keith St
- 303 Linnell St
- 216 Linnell St
- 290 W Road I S
- 0000 Road West M N
- Tbd Road West O S
- TBD Road West O S
- Lots Lakeview Rd
- 00010 Lakeview Rd
- Lot 1 W P St
- 301 Chuckwagon Rd
- 306 Hidden Canyon Estates
- 1106 Ethel Ave
- Lot 23 W County Road B
- 913 W 8th St
- 706 W H St
- 815 W 5th St
- 620 W G St
- A10 Lonesome Dove
- 195 Koenig Dr
Your Personal Tour Guide
Ask me questions while you tour the home.