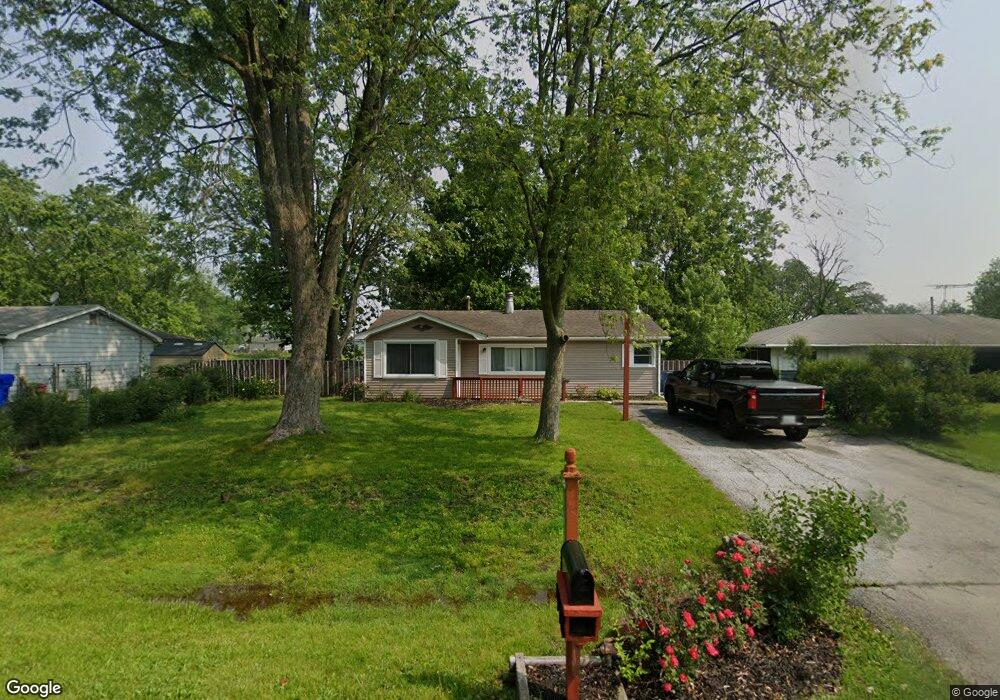
411 W Auburn Ln Crete, IL 60417
Goodenow NeighborhoodEstimated Value: $194,000 - $216,039
--
Bed
--
Bath
1,104
Sq Ft
$188/Sq Ft
Est. Value
About This Home
This home is located at 411 W Auburn Ln, Crete, IL 60417 and is currently estimated at $207,510, approximately $187 per square foot. 411 W Auburn Ln is a home located in Will County with nearby schools including Balmoral Elementary School, Crete-Monee Middle School, and Crete-Monee High School.
Ownership History
Date
Name
Owned For
Owner Type
Purchase Details
Closed on
Dec 27, 2024
Sold by
Ummaa Llc
Bought by
Golembiewski Austin and Golembiewski Joseph
Current Estimated Value
Home Financials for this Owner
Home Financials are based on the most recent Mortgage that was taken out on this home.
Original Mortgage
$196,377
Outstanding Balance
$194,965
Interest Rate
6.63%
Mortgage Type
FHA
Estimated Equity
$12,545
Purchase Details
Closed on
Apr 9, 2024
Sold by
Sheriff Of Will County
Bought by
Ummaa Llc
Purchase Details
Closed on
Jan 10, 2017
Sold by
Bussema Karen W
Bought by
Jones Alexander D
Home Financials for this Owner
Home Financials are based on the most recent Mortgage that was taken out on this home.
Original Mortgage
$100,152
Interest Rate
4.25%
Mortgage Type
FHA
Create a Home Valuation Report for This Property
The Home Valuation Report is an in-depth analysis detailing your home's value as well as a comparison with similar homes in the area
Home Values in the Area
Average Home Value in this Area
Purchase History
| Date | Buyer | Sale Price | Title Company |
|---|---|---|---|
| Golembiewski Austin | $200,000 | Chicago Title | |
| Golembiewski Austin | $200,000 | Chicago Title | |
| Ummaa Llc | $105,000 | None Listed On Document | |
| Jones Alexander D | $102,000 | Stewart Title |
Source: Public Records
Mortgage History
| Date | Status | Borrower | Loan Amount |
|---|---|---|---|
| Open | Golembiewski Austin | $196,377 | |
| Closed | Golembiewski Austin | $196,377 | |
| Previous Owner | Jones Alexander D | $100,152 |
Source: Public Records
Tax History Compared to Growth
Tax History
| Year | Tax Paid | Tax Assessment Tax Assessment Total Assessment is a certain percentage of the fair market value that is determined by local assessors to be the total taxable value of land and additions on the property. | Land | Improvement |
|---|---|---|---|---|
| 2024 | $4,831 | $50,266 | $6,780 | $43,486 |
| 2023 | $4,831 | $44,884 | $6,054 | $38,830 |
| 2022 | $3,898 | $39,889 | $5,380 | $34,509 |
| 2021 | $3,422 | $36,522 | $4,926 | $31,596 |
| 2020 | $3,283 | $34,229 | $4,617 | $29,612 |
| 2019 | $2,544 | $32,170 | $4,339 | $27,831 |
| 2018 | $2,485 | $31,478 | $4,246 | $27,232 |
| 2017 | $2,260 | $28,999 | $3,912 | $25,087 |
| 2016 | $1,573 | $28,812 | $3,887 | $24,925 |
| 2015 | $1,609 | $23,475 | $4,369 | $19,106 |
| 2014 | $1,609 | $23,712 | $4,413 | $19,299 |
| 2013 | $1,609 | $24,847 | $4,624 | $20,223 |
Source: Public Records
Map
Nearby Homes
- 26757 S Linden Ln
- 451 W Elms Court Ln
- 27150 S Fountainview Dr
- 112 Village Woods Dr
- 26732 S Balmoral Woods Dr
- 740 W Kent Ave
- 846 W Kent Ave
- 751 W Goodenow Rd
- 604 W New Monee Rd
- 258 S Root Dr
- 58 Partridge Ln Unit 58PART
- 0000 S Dixie Hwy
- 10 Swallow Ln
- 9 Swallow Ln
- 17 Meadowlark Ln Unit 17MEAD
- 85 Partridge Ln
- 79 Robin Ln Unit 79ROBI
- 1712 S Dixie Hwy Unit 132
- 1712 S Dixie Hwy Unit 211
- 1712 S Dixie Hwy Unit 227
- 448 W Auburn Ln
- 436 W Auburn Ln
- 452 W Auburn Ln
- 26739 S Linden Ln
- 456 W Auburn Ln
- 26749 S Linden Ln
- 435 W Auburn Ln
- 429 W Auburn Ln
- 451 W Elmscourt Ln
- 445 W Elmscourt Ln Unit 3
- 443 W Auburn Ln
- 462 W Auburn Ln
- 449 W Auburn Ln
- 502 W Auburn Ln
- 455 W Auburn Ln
- 455 W Elms Court Ln
- 505 W Elms Court Ln
- 437 W Elms Court Ln
- 423 W Elmscourt Ln
- 434 W Arlington Ln