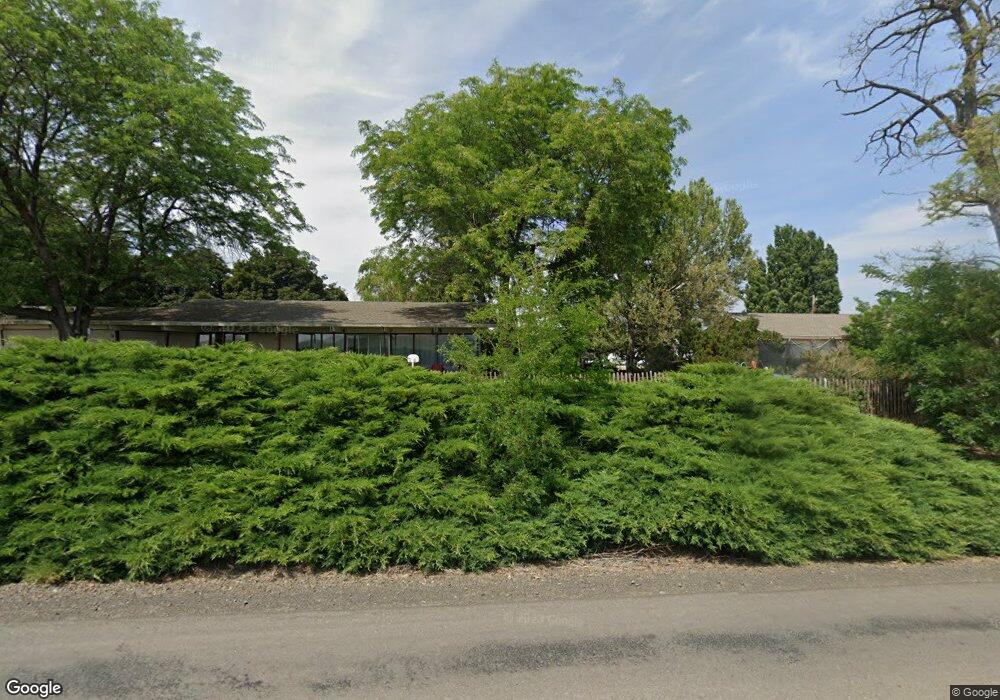
411 W Main St Athena, OR 97813
Estimated Value: $448,000 - $486,000
4
Beds
2
Baths
1,590
Sq Ft
$295/Sq Ft
Est. Value
About This Home
This home is located at 411 W Main St, Athena, OR 97813 and is currently estimated at $469,617, approximately $295 per square foot. 411 W Main St is a home located in Umatilla County with nearby schools including Athena Elementary School, Weston Middle School, and Weston-McEwen High School.
Ownership History
Date
Name
Owned For
Owner Type
Purchase Details
Closed on
Jun 29, 2010
Sold by
Johnston Marjorie R
Bought by
Rudolph Todd Robert
Current Estimated Value
Home Financials for this Owner
Home Financials are based on the most recent Mortgage that was taken out on this home.
Original Mortgage
$168,000
Outstanding Balance
$112,195
Interest Rate
4.82%
Mortgage Type
New Conventional
Estimated Equity
$357,422
Purchase Details
Closed on
Sep 2, 2008
Sold by
Carlin Michael D and Carlin Kimberly D
Bought by
Johnston Marjorie R
Purchase Details
Closed on
Nov 1, 2005
Sold by
Smith Terry J and Albert Karen A
Bought by
Carlin Michael D and Carlin Kimberly D
Home Financials for this Owner
Home Financials are based on the most recent Mortgage that was taken out on this home.
Original Mortgage
$107,300
Interest Rate
5.74%
Mortgage Type
New Conventional
Create a Home Valuation Report for This Property
The Home Valuation Report is an in-depth analysis detailing your home's value as well as a comparison with similar homes in the area
Home Values in the Area
Average Home Value in this Area
Purchase History
| Date | Buyer | Sale Price | Title Company |
|---|---|---|---|
| Rudolph Todd Robert | $210,000 | Amerititle | |
| Johnston Marjorie R | $210,000 | Amerititle | |
| Carlin Michael D | $160,000 | Amerititle |
Source: Public Records
Mortgage History
| Date | Status | Borrower | Loan Amount |
|---|---|---|---|
| Open | Rudolph Todd Robert | $168,000 | |
| Previous Owner | Carlin Michael D | $107,300 |
Source: Public Records
Tax History Compared to Growth
Tax History
| Year | Tax Paid | Tax Assessment Tax Assessment Total Assessment is a certain percentage of the fair market value that is determined by local assessors to be the total taxable value of land and additions on the property. | Land | Improvement |
|---|---|---|---|---|
| 2024 | $4,828 | $233,500 | $32,100 | $201,400 |
| 2023 | $4,687 | $226,710 | $31,170 | $195,540 |
| 2022 | $4,383 | $220,110 | $0 | $0 |
| 2021 | $4,412 | $213,710 | $26,190 | $187,520 |
| 2020 | $4,162 | $207,490 | $25,430 | $182,060 |
| 2018 | $3,858 | $194,920 | $23,300 | $171,620 |
| 2017 | $3,753 | $189,250 | $22,620 | $166,630 |
| 2016 | $3,572 | $183,740 | $21,960 | $161,780 |
| 2015 | $3,435 | $168,190 | $20,100 | $148,090 |
| 2014 | $3,196 | $168,190 | $20,100 | $148,090 |
Source: Public Records
Map
Nearby Homes
- 360 W College St
- 253 W College St
- 330 2nd St
- 355 W Washington St
- 229 E Darwin St
- 315 W Washington St
- 309 E Van Buren St
- 444 N 3rd St
- 216 E Washington St
- 310 E Washington St
- 454 E Main St
- 724 N 4th St
- 406 W Mill St
- 100 W Wallace St
- 115 N Water St
- 212 S Water St
- 309 S Water St
- 402 E Main St
- 170 Morrison St
- 75938 Spring Hollow Rd
- 413 W Main St
- 354 W Jefferson St
- 344 W Jefferson St
- 327 W Main St
- 324 W Jefferson St
- 355 W Jefferson St
- 345 Jefferson St
- 233 W Jefferson St
- 232 W Jefferson St
- 333 W Jefferson St
- 319 W Jefferson St
- 321 W Jefferson St
- 356 Van Buren St
- 234 W Jefferson St
- 210 Hunt St
- 324 Van Buren St
- 324 Van Buren St
- 324 W Van Buren St
- 157 S Beamer St
- 328 Van Buren St