
Seller's Agent in 2015
Anne Uzzo
C21/Wright Real Estate
(918) 931-7511
36 Total Sales
Estimated Value: $87,000 - $105,000
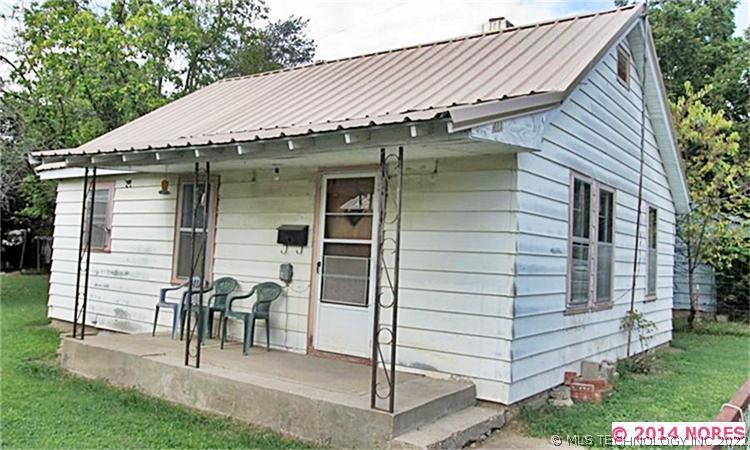
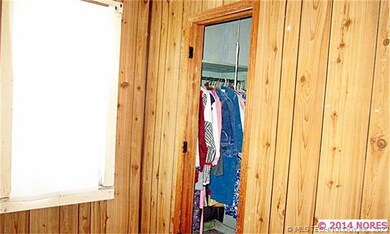
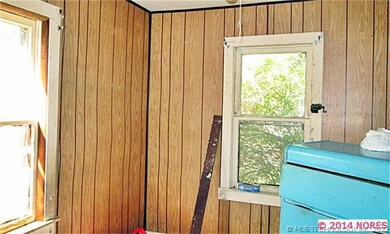
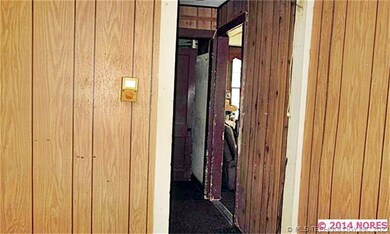
LOCATED CLOSE TO N.S.U. CUTE HOME WITH FENCED YARD AND METAL ROOF. PRICED TO SELL! SELLS `AS IS`.
| Date | Buyer | Sale Price | Title Company |
|---|---|---|---|
| Brown Gilbert W | $34,500 | Chicago Title |
| Date | Status | Borrower | Loan Amount |
|---|---|---|---|
| Open | Brown Gilbert W | $36,973 |
| Date | Event | Price | List to Sale | Price per Sq Ft |
|---|---|---|---|---|
| 02/06/2015 02/06/15 | Sold | $15,500 | -48.2% | $23 / Sq Ft |
| 08/19/2014 08/19/14 | Pending | -- | -- | -- |
| 08/19/2014 08/19/14 | For Sale | $29,900 | -- | $44 / Sq Ft |
| Year | Tax Paid | Tax Assessment Tax Assessment Total Assessment is a certain percentage of the fair market value that is determined by local assessors to be the total taxable value of land and additions on the property. | Land | Improvement |
|---|---|---|---|---|
| 2025 | $424 | $4,704 | $965 | $3,739 |
| 2024 | $424 | $4,480 | $919 | $3,561 |
| 2023 | $424 | $4,266 | $770 | $3,496 |
| 2022 | $396 | $4,266 | $770 | $3,496 |
| 2021 | $390 | $4,184 | $770 | $3,414 |
| 2020 | $378 | $3,985 | $770 | $3,215 |
| 2019 | $357 | $3,795 | $770 | $3,025 |
| 2018 | $361 | $3,795 | $770 | $3,025 |
| 2017 | $360 | $3,795 | $770 | $3,025 |
| 2016 | $182 | $1,905 | $770 | $1,135 |
| 2015 | $171 | $1,905 | $434 | $1,471 |
| 2014 | $171 | $1,814 | $310 | $1,504 |
Seller's Agent in 2015
Anne Uzzo
C21/Wright Real Estate
(918) 931-7511
36 Total Sales
Source: MLS Technology
MLS Number: 1426105
APN: 3001-00-007-003-0-001-00
Disclaimer: Certain information contained herein is derived from information provided by parties other than Homes.com. All information provided is deemed reliable, but is not guaranteed to be accurate and should be independently verified.
![]() IDX information is provided exclusively for personal, non-commercial use, and may not be used for any purpose other than to identify prospective properties consumers may be interested in purchasing.
IDX information is provided exclusively for personal, non-commercial use, and may not be used for any purpose other than to identify prospective properties consumers may be interested in purchasing.
Information is deemed reliable but not guaranteed.