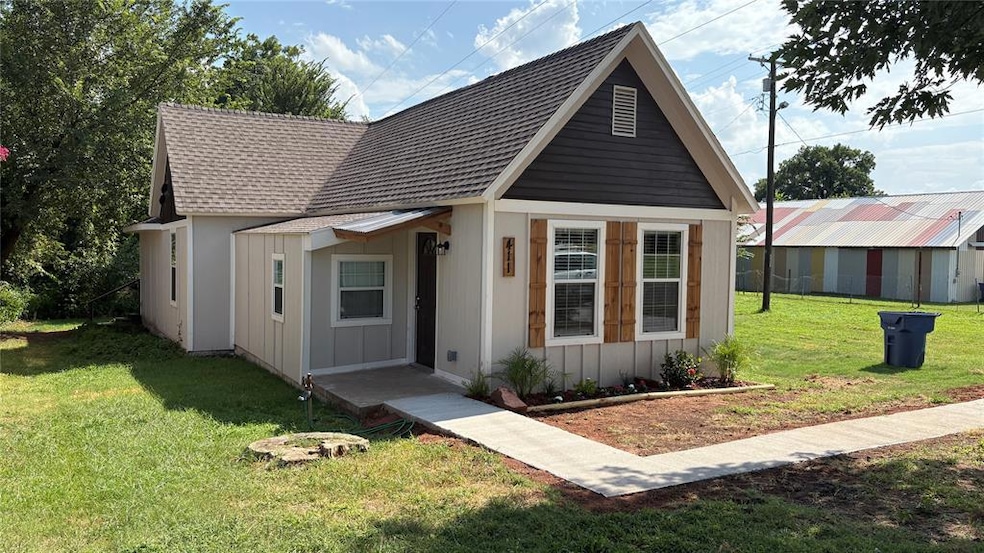
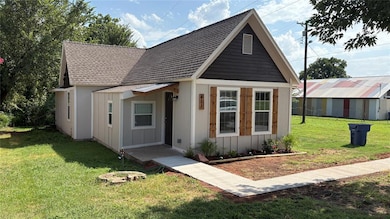
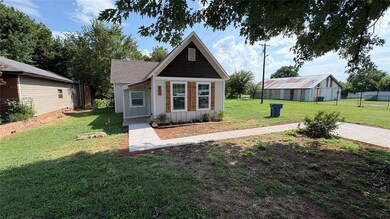
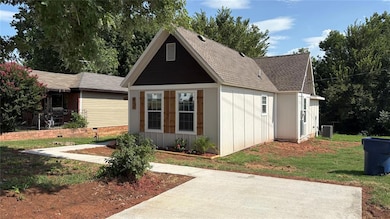
411 W Springer Ave Guthrie, OK 73044
Estimated payment $1,130/month
Highlights
- Covered Patio or Porch
- Bungalow
- Central Heating and Cooling System
- Interior Lot
- 1-Story Property
- North Facing Home
About This Home
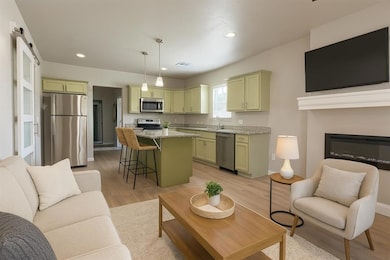
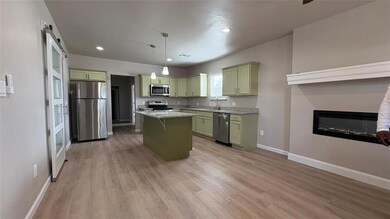
A beautifully renovated 3-bedroom, 2-bathroom home that perfectly blends modern style with small-town charm. Step inside and you’ll love the open-concept layout featuring luxury vinyl plank flooring, a spacious living area, and a sleek electric fireplace for cozy evenings.
The stunning kitchen boasts granite countertops, stainless steel appliances, a large island for casual dining, and soft sage cabinetry that adds a pop of character. Both bathrooms are fully updated, featuring modern fixtures and stylish tile work.
The exterior is just as inviting with its fresh siding, rustic wood shutters, and a newly poured sidewalk leading to the covered front entry. Enjoy a large yard with plenty of room to garden, play, or entertain.
Conveniently located near downtown Guthrie, you’ll be minutes from shopping, dining, and entertainment. This move-in-ready home is ideal for first-time buyers, downsizers, or anyone looking for a low-maintenance property with modern upgrades.
Home Details
Home Type
- Single Family
Est. Annual Taxes
- $270
Year Built
- Built in 1907
Lot Details
- 7,000 Sq Ft Lot
- North Facing Home
- Interior Lot
- Historic Home
Home Design
- Bungalow
- Frame Construction
- Composition Roof
Interior Spaces
- 1,389 Sq Ft Home
- 1-Story Property
- Electric Fireplace
Kitchen
- Electric Oven
- Electric Range
- Microwave
- Dishwasher
Flooring
- Carpet
- Vinyl
Bedrooms and Bathrooms
- 3 Bedrooms
- 2 Full Bathrooms
Parking
- No Garage
- Driveway
Schools
- Central Elementary School
- Guthrie JHS Middle School
- Guthrie High School
Additional Features
- Covered Patio or Porch
- Central Heating and Cooling System
Listing and Financial Details
- Legal Lot and Block 5 & 6 / 75
Map
Home Values in the Area
Average Home Value in this Area
Tax History
| Year | Tax Paid | Tax Assessment Tax Assessment Total Assessment is a certain percentage of the fair market value that is determined by local assessors to be the total taxable value of land and additions on the property. | Land | Improvement |
|---|---|---|---|---|
| 2025 | $270 | $14,723 | $693 | $14,030 |
| 2024 | $270 | $2,868 | $693 | $2,175 |
| 2023 | $270 | $2,731 | $693 | $2,038 |
| 2022 | $252 | $2,731 | $693 | $2,038 |
| 2021 | $253 | $2,731 | $693 | $2,038 |
| 2020 | $257 | $2,766 | $693 | $2,073 |
| 2019 | $258 | $2,734 | $663 | $2,071 |
| 2018 | $239 | $2,604 | $541 | $2,063 |
| 2017 | $224 | $2,479 | $425 | $2,054 |
| 2016 | $215 | $2,362 | $344 | $2,018 |
| 2014 | $163 | $2,142 | $276 | $1,866 |
| 2013 | $158 | $2,226 | $270 | $1,956 |
Property History
| Date | Event | Price | List to Sale | Price per Sq Ft |
|---|---|---|---|---|
| 10/06/2025 10/06/25 | Price Changed | $210,000 | -4.5% | $151 / Sq Ft |
| 07/24/2025 07/24/25 | For Sale | $220,000 | -- | $158 / Sq Ft |
Purchase History
| Date | Type | Sale Price | Title Company |
|---|---|---|---|
| Warranty Deed | $30,000 | American Eagle Title | |
| Warranty Deed | $30,000 | American Eagle Title | |
| Quit Claim Deed | -- | None Available |
Mortgage History
| Date | Status | Loan Amount | Loan Type |
|---|---|---|---|
| Open | $140,000 | Construction | |
| Closed | $140,000 | Construction |
Source: MLSOK
MLS Number: 1182268
APN: 420001583
Disclaimer: Certain information contained herein is derived from information provided by parties other than Homes.com. All information provided is deemed reliable, but is not guaranteed to be accurate and should be independently verified.
![]() IDX information is provided exclusively for personal, non-commercial use, and may not be used for any purpose other than to identify prospective properties consumers may be interested in purchasing.
IDX information is provided exclusively for personal, non-commercial use, and may not be used for any purpose other than to identify prospective properties consumers may be interested in purchasing.
Information is deemed reliable but not guaranteed.
This information is not verified for authenticity or accuracy, is not guaranteed and may not reflect all real estate activity in the market.
Copyright 2025 MLSOK, Inc. All rights reserved.
- 710 S 2nd St
- 318 S 2nd St
- 316 W Vilas Ave
- 219 W Lincoln Ave
- 514 N 1st St
- 124 W Noble Ave
- 312 S Ash St
- 403 E Vilas Ave
- 320 E Cleveland Ave
- 413 N Wentz St
- 515 E Harrison Ave
- 524 E Grant Ave
- 509 N Division St
- 322 E Warner Ave
- 1001 W Mansur Ave
- 114 N Elm St
- 602 N Wentz St
- 915 W Logan Ave
- 709 E Vilas Ave
- 923 W Logan Ave
- 117 W Harrison Ave Unit Vinyl Loft
- 411 E Harrison Ave Unit C
- 503 E Springer Ave Unit B
- 503 E Springer Ave
- 2521 W Oklahoma Ave
- 1626 Highland Loop
- 1620 Highland Loop
- 1023 Shady Creek Cir
- 700 Cottage Park Cir
- 3213 Hunt Ln
- 1590 Deerwood Trail
- 8900 Belcaro Dr
- 105 S Magnolia St
- 302 E Washington St
- 4220 Calm Waters Way
- 8316 Lambert Way
- 8317 Rainier St
- 8201 Crew Ln
- 8216 Crew Ln
- 4212 Abbey Park Dr
