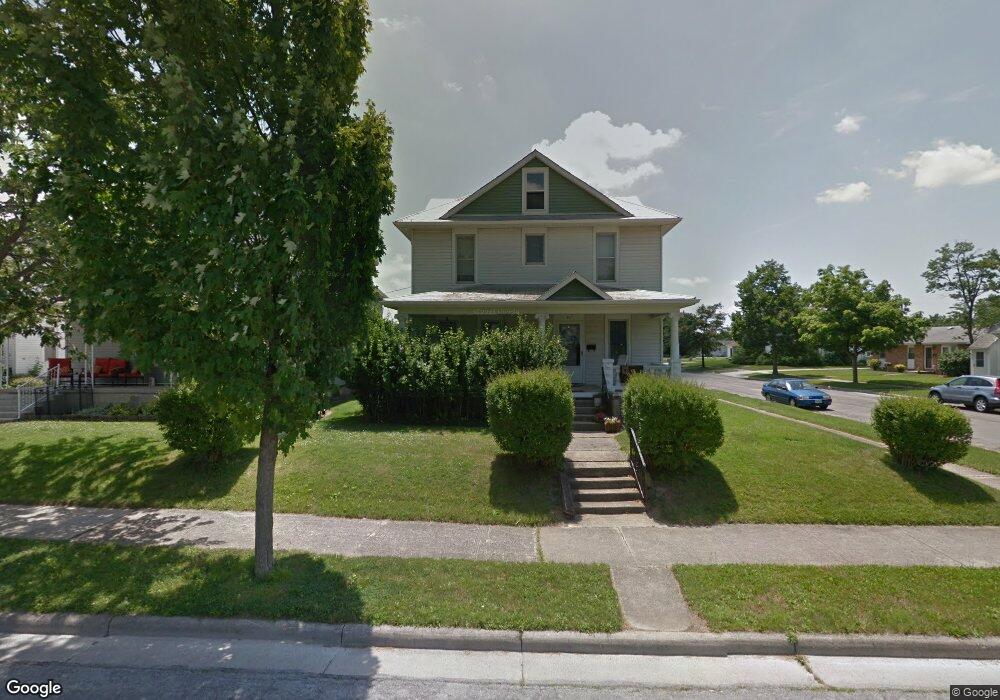
411 W Vine St Wapakoneta, OH 45895
Estimated Value: $161,000 - $180,000
4
Beds
2
Baths
1,804
Sq Ft
$95/Sq Ft
Est. Value
About This Home
This home is located at 411 W Vine St, Wapakoneta, OH 45895 and is currently estimated at $171,074, approximately $94 per square foot. 411 W Vine St is a home located in Auglaize County with nearby schools including Wapakoneta Elementary School, Wapakoneta High School, and Wapakoneta Middle School.
Ownership History
Date
Name
Owned For
Owner Type
Purchase Details
Closed on
Feb 10, 2016
Sold by
Walls Christine
Bought by
Walls Travis
Current Estimated Value
Purchase Details
Closed on
Dec 30, 2010
Sold by
Struble Nina L
Bought by
Walls Travis E
Home Financials for this Owner
Home Financials are based on the most recent Mortgage that was taken out on this home.
Original Mortgage
$81,300
Outstanding Balance
$54,519
Interest Rate
4.44%
Mortgage Type
New Conventional
Estimated Equity
$116,555
Purchase Details
Closed on
Dec 12, 2002
Sold by
Struble Chartley
Bought by
Struble Nina L
Create a Home Valuation Report for This Property
The Home Valuation Report is an in-depth analysis detailing your home's value as well as a comparison with similar homes in the area
Home Values in the Area
Average Home Value in this Area
Purchase History
| Date | Buyer | Sale Price | Title Company |
|---|---|---|---|
| Walls Travis | -- | Attorney | |
| Walls Travis E | $76,500 | Northwest Title Agency Co | |
| Struble Nina L | -- | -- |
Source: Public Records
Mortgage History
| Date | Status | Borrower | Loan Amount |
|---|---|---|---|
| Open | Walls Travis E | $81,300 |
Source: Public Records
Tax History Compared to Growth
Tax History
| Year | Tax Paid | Tax Assessment Tax Assessment Total Assessment is a certain percentage of the fair market value that is determined by local assessors to be the total taxable value of land and additions on the property. | Land | Improvement |
|---|---|---|---|---|
| 2024 | $2,158 | $44,260 | $8,160 | $36,100 |
| 2023 | $715 | $44,260 | $8,160 | $36,100 |
| 2022 | $1,275 | $35,890 | $7,480 | $28,410 |
| 2021 | $618 | $35,890 | $7,480 | $28,410 |
| 2020 | $1,259 | $35,886 | $7,480 | $28,406 |
| 2019 | $1,061 | $29,026 | $6,153 | $22,873 |
| 2018 | $1,065 | $29,026 | $6,153 | $22,873 |
| 2017 | $1,060 | $29,026 | $6,153 | $22,873 |
| 2016 | $1,021 | $28,042 | $5,768 | $22,274 |
| 2015 | $1,007 | $28,042 | $5,768 | $22,274 |
| 2014 | $1,018 | $28,042 | $5,768 | $22,274 |
| 2013 | $1,035 | $28,042 | $5,768 | $22,274 |
Source: Public Records
Map
Nearby Homes