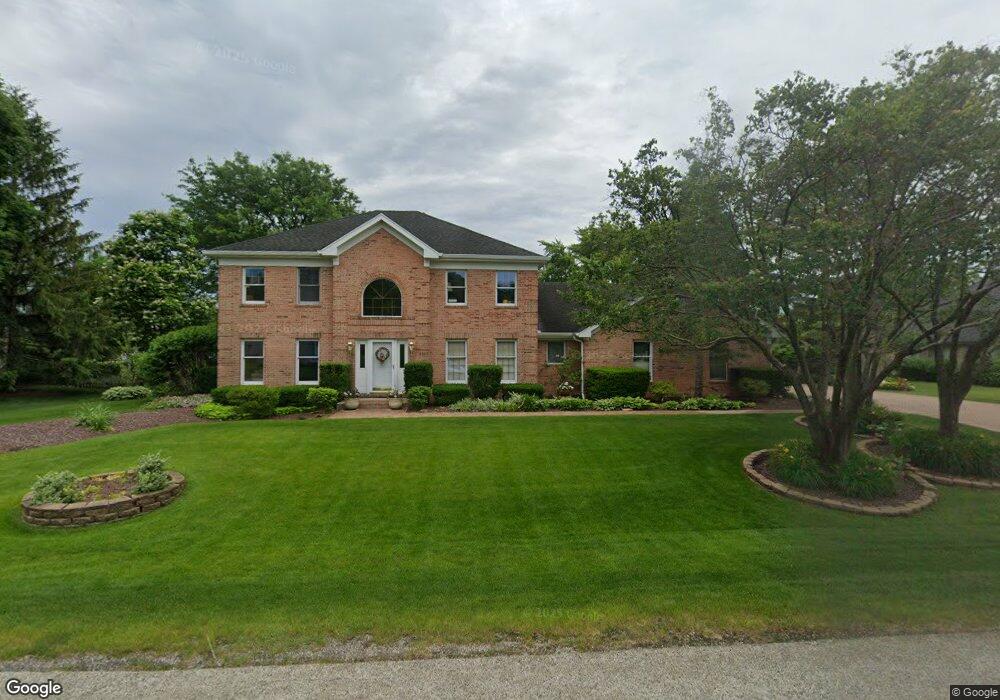
411 Walden Ln Prospect Heights, IL 60070
Estimated Value: $738,000 - $903,000
4
Beds
3
Baths
2,618
Sq Ft
$304/Sq Ft
Est. Value
About This Home
This home is located at 411 Walden Ln, Prospect Heights, IL 60070 and is currently estimated at $797,073, approximately $304 per square foot. 411 Walden Ln is a home located in Cook County with nearby schools including Dwight D Eisenhower Elementary School, Anne Sullivan Elementary School, and Betsy Ross Elementary School.
Ownership History
Date
Name
Owned For
Owner Type
Purchase Details
Closed on
Feb 14, 2003
Sold by
Braun Robert E and Braun Thelma C
Bought by
Braun Thelma C and Thelma C Braun Declaration Of Trust
Current Estimated Value
Purchase Details
Closed on
Nov 22, 2002
Sold by
Braun Thelma C and Braun Robert E
Bought by
Braun Robert E and Braun Thelma C
Purchase Details
Closed on
Aug 16, 1999
Sold by
Braun Robert E and Braun Thelma C
Bought by
Braun Robert E and Braun Thelma C
Purchase Details
Closed on
Oct 16, 1997
Sold by
Braun Thelma C and Braun Robert E
Bought by
Braun Robert E and Braun Thelma C
Home Financials for this Owner
Home Financials are based on the most recent Mortgage that was taken out on this home.
Original Mortgage
$136,600
Outstanding Balance
$20,837
Interest Rate
6.87%
Estimated Equity
$776,236
Purchase Details
Closed on
Jul 28, 1994
Sold by
Cole Taylor Bank
Bought by
Braun Thelma C and Braun Robert E
Create a Home Valuation Report for This Property
The Home Valuation Report is an in-depth analysis detailing your home's value as well as a comparison with similar homes in the area
Home Values in the Area
Average Home Value in this Area
Purchase History
| Date | Buyer | Sale Price | Title Company |
|---|---|---|---|
| Braun Thelma C | -- | -- | |
| Braun Thelma C | -- | -- | |
| Braun Robert E | -- | 1St American Title | |
| Braun Robert E | -- | -- | |
| Braun Robert E | -- | Burnet Title Llc | |
| Braun Thelma C | -- | Attorneys Title Guaranty Fun |
Source: Public Records
Mortgage History
| Date | Status | Borrower | Loan Amount |
|---|---|---|---|
| Open | Braun Robert E | $136,600 |
Source: Public Records
Tax History Compared to Growth
Tax History
| Year | Tax Paid | Tax Assessment Tax Assessment Total Assessment is a certain percentage of the fair market value that is determined by local assessors to be the total taxable value of land and additions on the property. | Land | Improvement |
|---|---|---|---|---|
| 2024 | $13,835 | $52,000 | $16,416 | $35,584 |
| 2023 | $12,918 | $52,000 | $16,416 | $35,584 |
| 2022 | $12,918 | $52,000 | $16,416 | $35,584 |
| 2021 | $12,229 | $43,289 | $10,260 | $33,029 |
| 2020 | $11,973 | $43,289 | $10,260 | $33,029 |
| 2019 | $11,960 | $48,368 | $10,260 | $38,108 |
| 2018 | $13,899 | $51,145 | $8,721 | $42,424 |
| 2017 | $13,776 | $51,145 | $8,721 | $42,424 |
| 2016 | $13,334 | $51,145 | $8,721 | $42,424 |
| 2015 | $13,178 | $46,439 | $7,695 | $38,744 |
| 2014 | $13,068 | $46,439 | $7,695 | $38,744 |
| 2013 | $12,715 | $46,439 | $7,695 | $38,744 |
Source: Public Records
Map
Nearby Homes
- 1044 Creekside Ct Unit 2B
- 412 Cherry Creek Ln
- 1500 Harbour Dr Unit 1D
- 1500 Harbour Dr Unit 2K
- 1054 Harbour Ct Unit 1A
- 1038 Harbour Ct Unit 2A
- 2060 N Charter Point Dr Unit 14
- 2143 E Peachtree Ln
- 21 E Stonegate Dr
- 1925 E Waverly Ln
- 1964 N Coldspring Rd Unit 52
- 791 Lakeside Circle Dr Unit 1
- 307 Anne Ct
- 1949 N Charter Point Dr Unit 1949
- 1956 N Lake Arlington Dr
- 1912 N Coldspring Rd Unit 96
- 10 N Wildwood Dr
- 2812 Jackson Dr
- 2616 N Prindle Ave
- 705 Lakeside Circle Dr Unit 2
- 409 Walden Ln
- 413 Walden Ln
- 410 Crest Hill Dr
- 410 Walden Ln
- 412 Crest Hill Dr
- 408 Crest Hill Dr
- 408 Walden Ln
- 412 Walden Ln
- 407 Walden Ln
- 406 Crest Hill Dr
- 409 Periwinkle Way
- 406 Walden Ln
- 411 Crest Hill Dr
- 411 Periwinkle Way
- 409 Crest Hill Dr
- 1006 Walden Ln
- 1008 Walden Ln
- 1004 Walden Ln
- 413 Crest Hill Dr
- 1010 Walden Ln