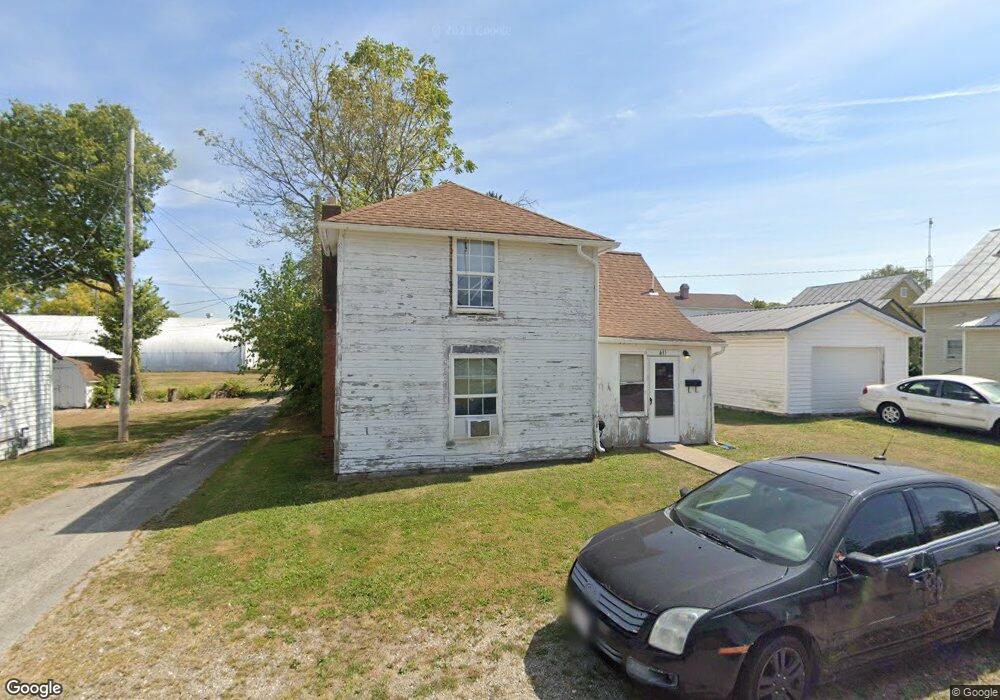
411 West St Greenville, OH 45331
Estimated Value: $56,000 - $102,000
2
Beds
1
Bath
931
Sq Ft
$83/Sq Ft
Est. Value
About This Home
This home is located at 411 West St, Greenville, OH 45331 and is currently estimated at $77,401, approximately $83 per square foot. 411 West St is a home with nearby schools including Greenville Middle School, Greenville Intermediate School, and Greenville Primary School.
Ownership History
Date
Name
Owned For
Owner Type
Purchase Details
Closed on
Aug 29, 2006
Sold by
Mansfield Donald L
Bought by
Fox Richard A and Fox Deborah A
Current Estimated Value
Home Financials for this Owner
Home Financials are based on the most recent Mortgage that was taken out on this home.
Original Mortgage
$41,154
Outstanding Balance
$24,849
Interest Rate
6.77%
Mortgage Type
FHA
Estimated Equity
$52,552
Purchase Details
Closed on
Dec 3, 2003
Sold by
Estate Of Weltha Lucille Mansfield
Bought by
Mansfield Donald L
Create a Home Valuation Report for This Property
The Home Valuation Report is an in-depth analysis detailing your home's value as well as a comparison with similar homes in the area
Home Values in the Area
Average Home Value in this Area
Purchase History
| Date | Buyer | Sale Price | Title Company |
|---|---|---|---|
| Fox Richard A | $41,800 | Attorney | |
| Mansfield Donald L | -- | -- |
Source: Public Records
Mortgage History
| Date | Status | Borrower | Loan Amount |
|---|---|---|---|
| Open | Fox Richard A | $41,154 |
Source: Public Records
Tax History Compared to Growth
Tax History
| Year | Tax Paid | Tax Assessment Tax Assessment Total Assessment is a certain percentage of the fair market value that is determined by local assessors to be the total taxable value of land and additions on the property. | Land | Improvement |
|---|---|---|---|---|
| 2024 | $570 | $16,130 | $2,690 | $13,440 |
| 2023 | $570 | $16,130 | $2,690 | $13,440 |
| 2022 | $545 | $14,010 | $2,240 | $11,770 |
| 2021 | $547 | $14,010 | $2,240 | $11,770 |
| 2020 | $549 | $14,010 | $2,240 | $11,770 |
| 2019 | $511 | $12,940 | $2,240 | $10,700 |
| 2018 | $514 | $12,940 | $2,240 | $10,700 |
| 2017 | $293 | $12,940 | $2,240 | $10,700 |
| 2016 | $294 | $7,270 | $2,240 | $5,030 |
| 2015 | $294 | $7,270 | $2,240 | $5,030 |
| 2014 | $294 | $7,270 | $2,240 | $5,030 |
| 2013 | $319 | $7,820 | $2,240 | $5,580 |
Source: Public Records
Map
Nearby Homes