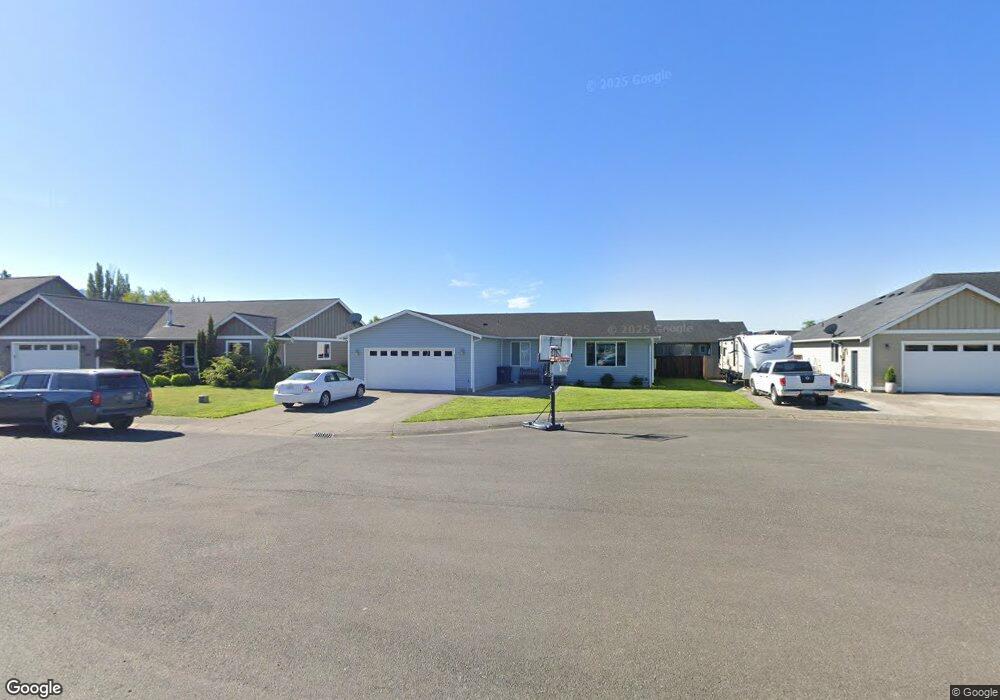
411 Westview Place Nooksack, WA 98247
Estimated Value: $526,772 - $553,000
3
Beds
2
Baths
1,664
Sq Ft
$322/Sq Ft
Est. Value
About This Home
This home is located at 411 Westview Place, Nooksack, WA 98247 and is currently estimated at $536,193, approximately $322 per square foot. 411 Westview Place is a home located in Whatcom County with nearby schools including Nooksack Elementary School, Everson Elementary School, and Sumas Elementary School.
Ownership History
Date
Name
Owned For
Owner Type
Purchase Details
Closed on
Jan 22, 2021
Sold by
Anderson Dean and Anderson Stephanie
Bought by
Anderson Stephanie
Current Estimated Value
Home Financials for this Owner
Home Financials are based on the most recent Mortgage that was taken out on this home.
Original Mortgage
$159,400
Outstanding Balance
$129,422
Interest Rate
2.67%
Mortgage Type
New Conventional
Estimated Equity
$406,771
Purchase Details
Closed on
Dec 15, 2008
Sold by
Hammingh Michael H and Hammingh Treva D
Bought by
Anderson Dean and Anderson Stephanie
Home Financials for this Owner
Home Financials are based on the most recent Mortgage that was taken out on this home.
Original Mortgage
$202,000
Interest Rate
5.97%
Mortgage Type
Construction
Purchase Details
Closed on
Jul 9, 2008
Sold by
Johnson Construction & Excavating Inc
Bought by
Hammingh Michael H and Hammingh Treva D
Home Financials for this Owner
Home Financials are based on the most recent Mortgage that was taken out on this home.
Original Mortgage
$41,600
Interest Rate
6.04%
Mortgage Type
Purchase Money Mortgage
Create a Home Valuation Report for This Property
The Home Valuation Report is an in-depth analysis detailing your home's value as well as a comparison with similar homes in the area
Home Values in the Area
Average Home Value in this Area
Purchase History
| Date | Buyer | Sale Price | Title Company |
|---|---|---|---|
| Anderson Stephanie | -- | Chicago Title | |
| Anderson Dean | $68,180 | First American Title Ins Co | |
| Hammingh Michael H | $52,280 | Chicago Title Insurance |
Source: Public Records
Mortgage History
| Date | Status | Borrower | Loan Amount |
|---|---|---|---|
| Open | Anderson Stephanie | $159,400 | |
| Closed | Anderson Dean | $202,000 | |
| Previous Owner | Hammingh Michael H | $41,600 |
Source: Public Records
Tax History Compared to Growth
Tax History
| Year | Tax Paid | Tax Assessment Tax Assessment Total Assessment is a certain percentage of the fair market value that is determined by local assessors to be the total taxable value of land and additions on the property. | Land | Improvement |
|---|---|---|---|---|
| 2024 | $4,513 | $455,292 | $180,000 | $275,292 |
| 2023 | $4,513 | $489,685 | $137,744 | $351,941 |
| 2022 | $4,022 | $441,166 | $124,096 | $317,070 |
| 2021 | $3,736 | $364,605 | $102,560 | $262,045 |
| 2020 | $3,585 | $296,433 | $83,384 | $213,049 |
| 2019 | $3,031 | $296,433 | $83,384 | $213,049 |
| 2018 | $3,079 | $284,403 | $80,000 | $204,403 |
| 2017 | $2,759 | $214,979 | $63,800 | $151,179 |
| 2016 | $2,639 | $198,380 | $58,850 | $139,530 |
| 2015 | $2,249 | $190,336 | $56,760 | $133,576 |
| 2014 | -- | $184,434 | $55,000 | $129,434 |
| 2013 | -- | $184,434 | $55,000 | $129,434 |
Source: Public Records
Map
Nearby Homes
- 406 Harrison Ln
- 409 Amareen Ct
- 506 Amareen Ct
- 215 Allison Way
- 1204 E Georgia Ln
- 407 E 2nd St
- 516 Allison Way
- 609 E 4th St
- 709 E 3rd St
- 207 E Main St
- 108 Baker St Unit 1-4
- 709 E 5th St
- 717 E 5th St
- 706 E 5th St
- 710 E 5th St
- 107 W 4th St
- 205 Reeds Ln Unit 64
- 714 E 5th St
- 921 Whispering Meadows Ct
- 721 E 5th St
- 409 Westview Place
- 501 Westview Place
- 412 Harrison Ln
- 412 Harrison Ln
- 410 Harrison Ln
- 407 Westview Place
- 408 Harrison Ln
- 503 W View Place
- 503 Westview Place
- 502 Harrison Ln
- 502 Harrison Ln
- 505 Westview Place
- 412 Westview Place
- 410 Westview Place
- 406 Harrison Ln
- 502 Westview Place
- 504 Harrison Ln
- 408 Westview Place