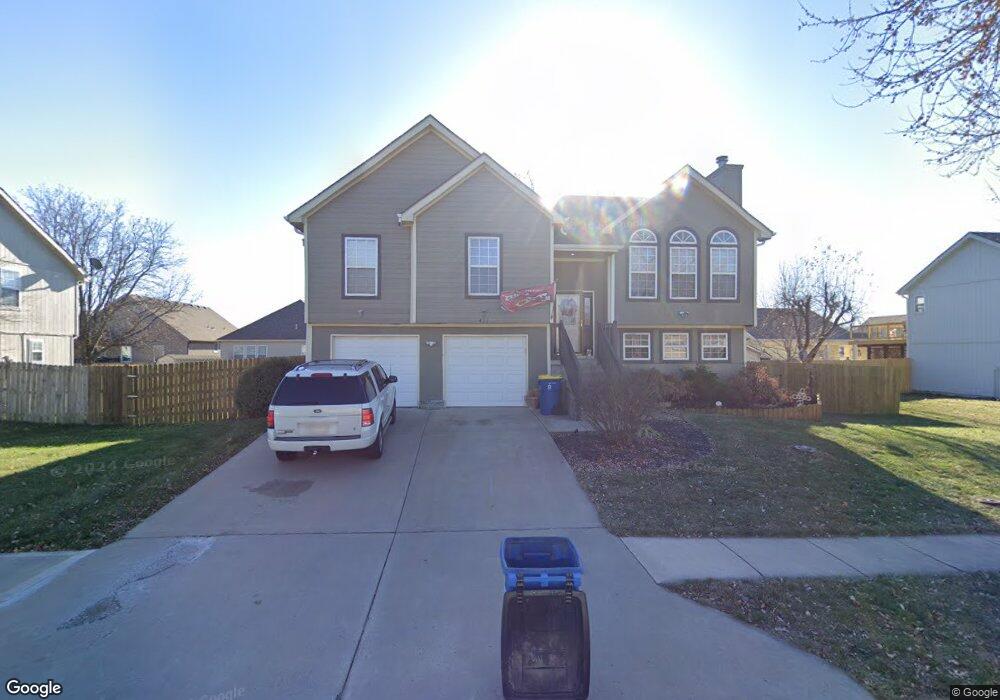
411 Wildflower Ln Kearney, MO 64060
Estimated Value: $310,000 - $316,000
3
Beds
3
Baths
1,328
Sq Ft
$236/Sq Ft
Est. Value
About This Home
This home is located at 411 Wildflower Ln, Kearney, MO 64060 and is currently estimated at $313,716, approximately $236 per square foot. 411 Wildflower Ln is a home located in Clay County with nearby schools including Kearney Junior High School and Kearney High School.
Ownership History
Date
Name
Owned For
Owner Type
Purchase Details
Closed on
Dec 29, 2003
Sold by
Caskey Bryan and Caskey Vanessa
Bought by
Fitzgerald Cindy E
Current Estimated Value
Home Financials for this Owner
Home Financials are based on the most recent Mortgage that was taken out on this home.
Original Mortgage
$111,200
Outstanding Balance
$54,122
Interest Rate
6.49%
Mortgage Type
Purchase Money Mortgage
Estimated Equity
$259,594
Purchase Details
Closed on
Aug 13, 1998
Sold by
Miller Thomas A and Miller Clydie
Bought by
Caskey Bryan and Caskey Vanessa
Home Financials for this Owner
Home Financials are based on the most recent Mortgage that was taken out on this home.
Original Mortgage
$111,510
Interest Rate
6.75%
Purchase Details
Closed on
Oct 30, 1997
Sold by
Sadenco Inc
Bought by
Miller Thomas A and Miller Clydie
Home Financials for this Owner
Home Financials are based on the most recent Mortgage that was taken out on this home.
Original Mortgage
$102,850
Interest Rate
7.28%
Create a Home Valuation Report for This Property
The Home Valuation Report is an in-depth analysis detailing your home's value as well as a comparison with similar homes in the area
Home Values in the Area
Average Home Value in this Area
Purchase History
| Date | Buyer | Sale Price | Title Company |
|---|---|---|---|
| Fitzgerald Cindy E | -- | United Title Company Inc | |
| Caskey Bryan | -- | Thomson Title Corp | |
| Miller Thomas A | -- | -- |
Source: Public Records
Mortgage History
| Date | Status | Borrower | Loan Amount |
|---|---|---|---|
| Open | Fitzgerald Cindy E | $111,200 | |
| Previous Owner | Caskey Bryan | $111,510 | |
| Previous Owner | Miller Thomas A | $102,850 | |
| Closed | Fitzgerald Cindy E | $27,800 |
Source: Public Records
Tax History Compared to Growth
Tax History
| Year | Tax Paid | Tax Assessment Tax Assessment Total Assessment is a certain percentage of the fair market value that is determined by local assessors to be the total taxable value of land and additions on the property. | Land | Improvement |
|---|---|---|---|---|
| 2025 | $2,590 | $43,420 | -- | -- |
| 2024 | $2,590 | $37,790 | -- | -- |
| 2023 | $2,581 | $37,790 | $0 | $0 |
| 2022 | $2,386 | $33,780 | $0 | $0 |
| 2021 | $2,339 | $33,782 | $3,800 | $29,982 |
| 2020 | $2,307 | $30,310 | $0 | $0 |
| 2019 | $2,295 | $30,310 | $0 | $0 |
| 2018 | $2,272 | $28,980 | $0 | $0 |
| 2017 | $2,130 | $28,980 | $3,800 | $25,180 |
| 2016 | $2,130 | $27,460 | $4,180 | $23,280 |
| 2015 | $2,130 | $27,460 | $4,180 | $23,280 |
| 2014 | $2,140 | $27,460 | $4,180 | $23,280 |
Source: Public Records
Map
Nearby Homes
- 417 Wildflower Ln
- 2212 Blue Bell Terrace
- 210 E 22nd St
- 2211 Prairie Creek Dr
- 2129 Greenfield Point Unit 20
- 2119 Greenfield Point
- 2125 Greenfield Point
- 2123 Greenfield Point
- 2121 Greenfield Point
- 2341 Fishing Ln
- 2333 Fishing Ln
- 2304 Foxtail Dr
- 2309 Fishing Ln
- 2059 Foxtail Point
- 2318 Larkspur Ln
- 2316 Larkspur Ln
- 2305 Larkspur Ln
- Charleston Plan at The Meadows At Greenfield - The Meadows at Greenfield
- Oakwood Plan at The Meadows At Greenfield - The Meadows at Greenfield
- Villa B Plan at The Meadows At Greenfield - The Meadows at Greenfield
- 413 Wildflower Ln
- 409 Wildflower Ln
- 406 Evening Star Dr
- 408 Evening Star Dr
- 410 Evening Star Dr
- 404 Evening Star Dr
- 407 Wildflower Ln
- 415 Wildflower Ln
- 406 Wildflower Ln
- 408 Wildflower Ln
- 404 Wildflower Ln
- 402 Evening Star Dr
- 410 Wildflower Ln
- 405 Wildflower Ln
- 409 Evening Star Dr
- 400 Evening Star Dr
- 407 Evening Star Dr
- 411 Evening Star Dr
- 414 Evening Star Dr
- 412 Wildflower Ln