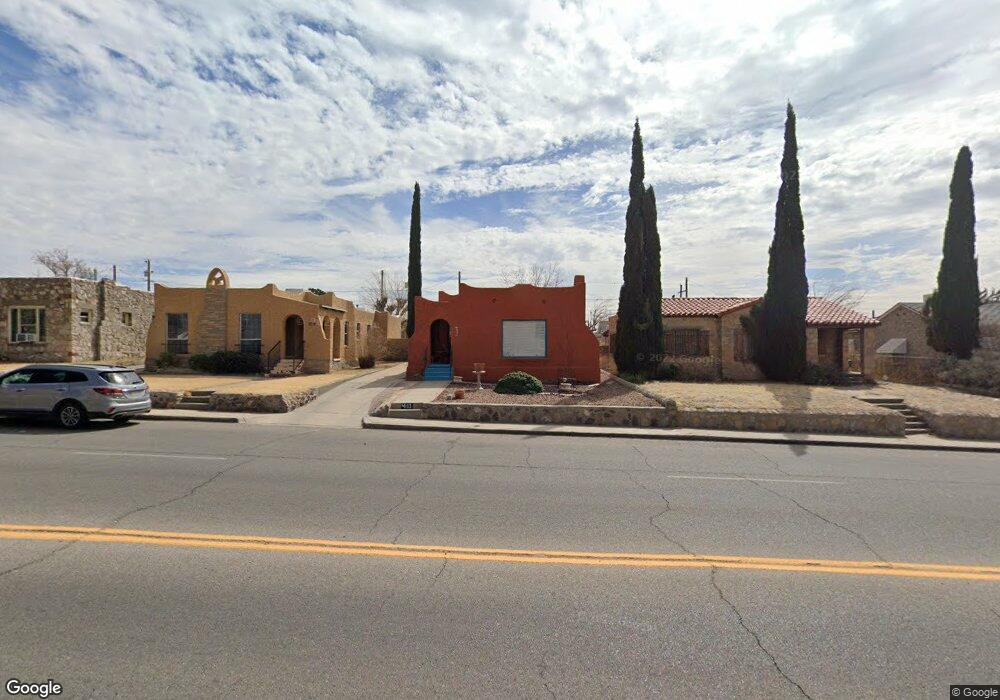
4110 Altura Ave El Paso, TX 79903
Five Points NeighborhoodEstimated Value: $165,809 - $239,000
3
Beds
2
Baths
1,244
Sq Ft
$162/Sq Ft
Est. Value
About This Home
This home is located at 4110 Altura Ave, El Paso, TX 79903 and is currently estimated at $201,202, approximately $161 per square foot. 4110 Altura Ave is a home located in El Paso County with nearby schools including Coldwell Elementary School, Armendariz Middle School, and Middle School-5 NW Middle.
Ownership History
Date
Name
Owned For
Owner Type
Purchase Details
Closed on
Jun 24, 2022
Sold by
Look Herrera Nancy
Bought by
Gibson John S and Gibson Carmen E
Current Estimated Value
Home Financials for this Owner
Home Financials are based on the most recent Mortgage that was taken out on this home.
Original Mortgage
$120,000
Outstanding Balance
$114,161
Interest Rate
5.25%
Mortgage Type
New Conventional
Estimated Equity
$87,041
Purchase Details
Closed on
Jun 22, 2015
Sold by
Look Herrera Nancy
Bought by
Herrera Edward
Purchase Details
Closed on
May 27, 2009
Sold by
Herrera Edward
Bought by
Look Herrera Nancy
Purchase Details
Closed on
Dec 23, 1999
Sold by
Cruz Leticia
Bought by
Look Nancy
Home Financials for this Owner
Home Financials are based on the most recent Mortgage that was taken out on this home.
Original Mortgage
$50,000
Interest Rate
10.62%
Create a Home Valuation Report for This Property
The Home Valuation Report is an in-depth analysis detailing your home's value as well as a comparison with similar homes in the area
Home Values in the Area
Average Home Value in this Area
Purchase History
| Date | Buyer | Sale Price | Title Company |
|---|---|---|---|
| Gibson John S | -- | None Listed On Document | |
| Herrera Edward | -- | None Available | |
| Look Herrera Nancy | -- | None Available | |
| Look Nancy | -- | -- |
Source: Public Records
Mortgage History
| Date | Status | Borrower | Loan Amount |
|---|---|---|---|
| Open | Gibson John S | $120,000 | |
| Previous Owner | Look Nancy | $50,000 | |
| Closed | Look Nancy | $15,000 | |
| Closed | Look Herrera Nancy | $0 |
Source: Public Records
Tax History Compared to Growth
Tax History
| Year | Tax Paid | Tax Assessment Tax Assessment Total Assessment is a certain percentage of the fair market value that is determined by local assessors to be the total taxable value of land and additions on the property. | Land | Improvement |
|---|---|---|---|---|
| 2025 | $1,553 | $143,600 | -- | -- |
| 2024 | $1,553 | $127,145 | -- | -- |
| 2023 | $1,494 | $116,477 | $16,129 | $100,348 |
| 2022 | $3,271 | $110,502 | $16,129 | $94,373 |
| 2021 | $2,804 | $89,798 | $16,129 | $73,669 |
| 2020 | $2,500 | $81,338 | $13,524 | $67,814 |
| 2018 | $2,390 | $80,755 | $13,524 | $67,231 |
| 2017 | $2,116 | $75,133 | $13,524 | $61,609 |
| 2016 | $2,116 | $75,133 | $13,524 | $61,609 |
| 2015 | $2,222 | $75,133 | $13,524 | $61,609 |
| 2014 | $2,222 | $81,193 | $13,524 | $67,669 |
Source: Public Records
Map
Nearby Homes
- 4122 Cumberland Ave
- 3816 Hastings Dr
- 3919 Cumberland Ave
- 4405 Cumberland Ave
- 4327 Chester Ave
- 2518 Partello St
- 19 Cumberland Cir
- 4000 Oxford Ave
- 4325 Oxford Ave
- 3817 Frankfort Ave
- 4101 Trowbridge Dr
- 4308 Oxford Ave
- 3625 Richmond Ave
- 4420 Oxford Ave
- 3905 Nashville Ave
- 1401 N Boone St
- 4504 Nashville Ave
- 3921 Mobile Ave
- 4620 Frankfort Ave
- 4013 Hueco Ave
- 4112 Altura Ave
- 4106 Altura Ave
- 4114 Altura Ave
- 4100 Altura Ave
- 4120 Altura Ave
- 4120 Altura Ave
- 4109 Hastings Dr
- 4111 Hastings Dr
- 4128 Altura Ave
- 4101 Hastings Dr
- 4115 Hastings Dr
- 4117 Hastings Dr Unit 4119
- 3948 Altura Ave
- 4123 Hastings Dr
- 4140 Altura Ave
- 4125 Hastings Dr
- 3944 Altura Ave
- 4027 Hastings Dr
- 4127 Hastings Dr
- 4127 Hastings Dr Unit 1