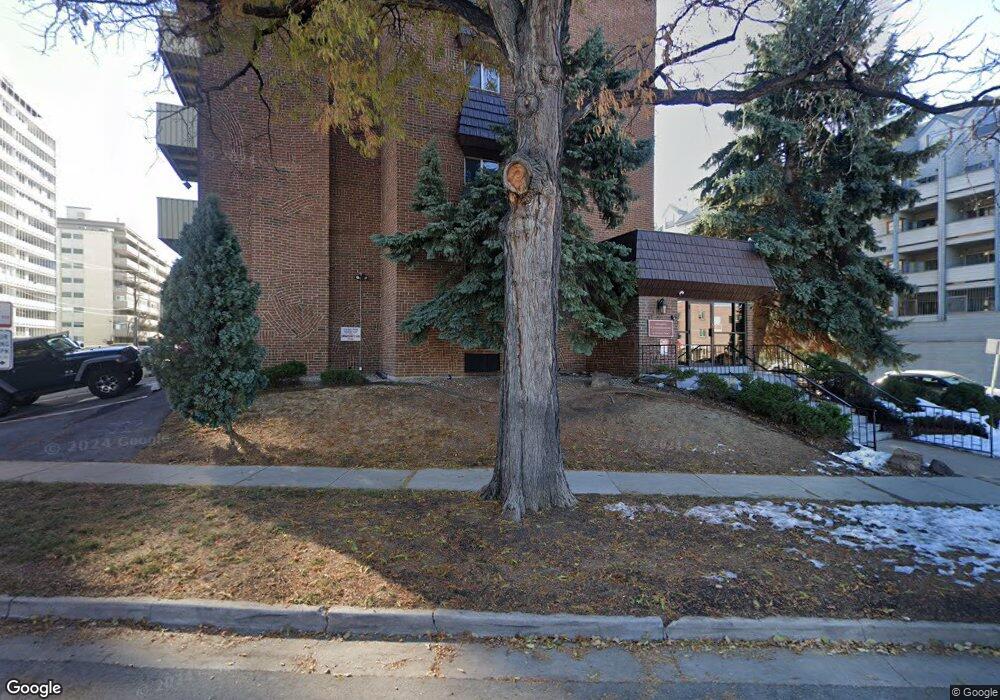
4110 E Hale Pkwy Unit 2A Denver, CO 80220
Hale NeighborhoodEstimated Value: $202,000 - $221,318
1
Bed
1
Bath
617
Sq Ft
$342/Sq Ft
Est. Value
About This Home
This home is located at 4110 E Hale Pkwy Unit 2A, Denver, CO 80220 and is currently estimated at $211,080, approximately $342 per square foot. 4110 E Hale Pkwy Unit 2A is a home located in Denver County with nearby schools including Palmer Elementary School, Hill Campus of Arts & Sciences, and East High School.
Ownership History
Date
Name
Owned For
Owner Type
Purchase Details
Closed on
Nov 4, 2022
Sold by
Bobow Llc
Bought by
Rhyne Linda
Current Estimated Value
Purchase Details
Closed on
Oct 25, 2016
Sold by
Klein Boris
Bought by
Bobow Llc
Home Financials for this Owner
Home Financials are based on the most recent Mortgage that was taken out on this home.
Original Mortgage
$4,012,000
Interest Rate
3.48%
Mortgage Type
Commercial
Purchase Details
Closed on
Dec 9, 2010
Sold by
Klein Boris and Klein Boris A
Bought by
Great Investments Llc
Home Financials for this Owner
Home Financials are based on the most recent Mortgage that was taken out on this home.
Original Mortgage
$121,735
Interest Rate
4.18%
Mortgage Type
Purchase Money Mortgage
Purchase Details
Closed on
Mar 2, 2001
Sold by
Close Euriela L
Bought by
Klein Boris
Create a Home Valuation Report for This Property
The Home Valuation Report is an in-depth analysis detailing your home's value as well as a comparison with similar homes in the area
Home Values in the Area
Average Home Value in this Area
Purchase History
| Date | Buyer | Sale Price | Title Company |
|---|---|---|---|
| Rhyne Linda | $244,900 | Fitco | |
| Bobow Llc | -- | Homestead Title & Escrow | |
| Great Investments Llc | -- | Capital Title Llc | |
| Klein Boris | $53,460 | Land Title |
Source: Public Records
Mortgage History
| Date | Status | Borrower | Loan Amount |
|---|---|---|---|
| Previous Owner | Bobow Llc | $4,012,000 | |
| Previous Owner | Great Investments Llc | $121,735 |
Source: Public Records
Tax History Compared to Growth
Tax History
| Year | Tax Paid | Tax Assessment Tax Assessment Total Assessment is a certain percentage of the fair market value that is determined by local assessors to be the total taxable value of land and additions on the property. | Land | Improvement |
|---|---|---|---|---|
| 2024 | $986 | $12,450 | $2,630 | $9,820 |
| 2023 | $965 | $12,450 | $2,630 | $9,820 |
| 2022 | $953 | $11,980 | $1,780 | $10,200 |
| 2021 | $919 | $12,320 | $1,830 | $10,490 |
| 2020 | $930 | $12,530 | $1,690 | $10,840 |
| 2019 | $904 | $12,530 | $1,690 | $10,840 |
| 2018 | $759 | $9,810 | $1,420 | $8,390 |
| 2017 | $757 | $9,810 | $1,420 | $8,390 |
| 2016 | $432 | $5,300 | $1,409 | $3,891 |
| 2015 | $414 | $5,300 | $1,409 | $3,891 |
| 2014 | $354 | $4,260 | $812 | $3,448 |
Source: Public Records
Map
Nearby Homes
- 4110 Hale Pkwy Unit 4J
- 4110 Hale Pkwy Unit 1E
- 4110 Hale Pkwy Unit 6C
- 1155 Ash St Unit 804
- 1155 Ash St Unit 908
- 1155 Ash St Unit 1204
- 1155 Ash St Unit 202
- 1155 Ash St Unit 1202
- 1155 Ash St Unit 306
- 1121 Albion St Unit 809
- 1121 Albion St Unit 402
- 1121 Albion St Unit 709
- 1121 Albion St Unit 207
- 1121 Albion St Unit 906
- 1121 Albion St Unit 305
- 1244 Albion St
- 1137 Colorado Blvd
- 1065 Colorado Blvd
- 1101 Bellaire St Unit 108
- 1140 Harrison St
- 4110 E Hale Pkwy Unit 1C
- 4110 E Hale Pkwy
- 4110 E Hale Pkwy Unit 2G
- 4110 E Hale Pkwy Unit 5D
- 4110 E Hale Pkwy Unit 3D
- 4110 E Hale Pkwy Unit 2K
- 4110 E Hale Pkwy Unit 3A
- 4110 E Hale Pkwy Unit 6C
- 4110 Hale Pkwy Unit 4G
- 4110 Hale Pkwy Unit 5E
- 4110 Hale Pkwy Unit 1A
- 4110 Hale Pkwy Unit 6H
- 4110 Hale Pkwy
- 4110 Hale Pkwy Unit 6F
- 4110 Hale Pkwy Unit 6E
- 4110 Hale Pkwy
- 4110 Hale Pkwy
- 4110 Hale Pkwy Unit 5K
- 4110 Hale Pkwy Unit 5J
- 4110 Hale Pkwy Unit 5H