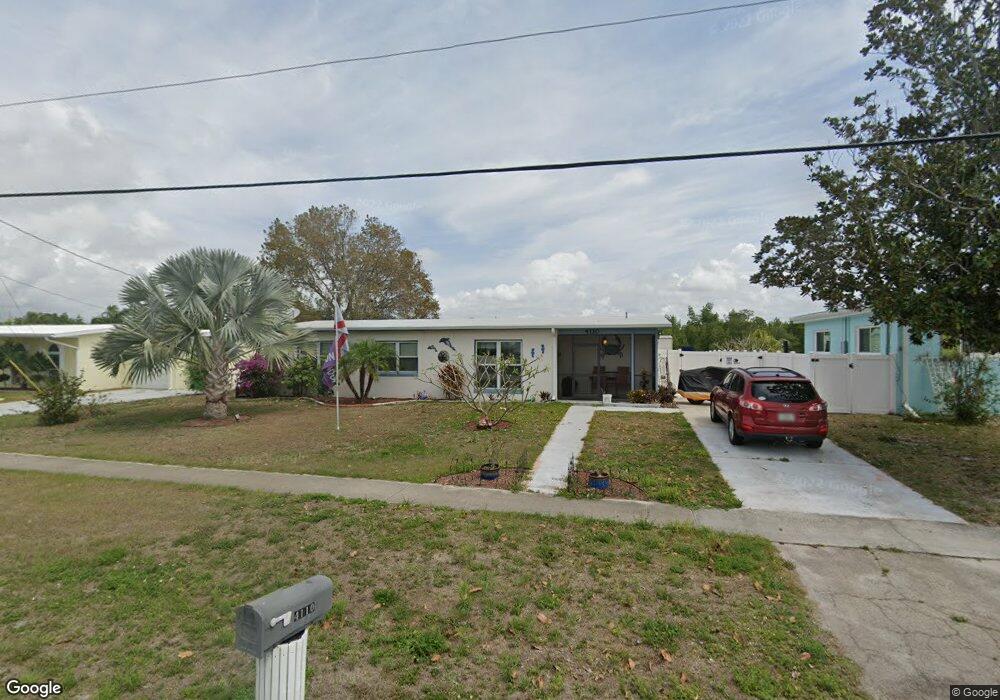
4110 Gardner Dr Port Charlotte, FL 33952
Estimated Value: $216,458 - $258,000
3
Beds
1
Bath
1,325
Sq Ft
$181/Sq Ft
Est. Value
About This Home
This home is located at 4110 Gardner Dr, Port Charlotte, FL 33952 and is currently estimated at $240,365, approximately $181 per square foot. 4110 Gardner Dr is a home located in Charlotte County with nearby schools including Peace River Elementary School, Port Charlotte Middle School, and Charlotte High School.
Ownership History
Date
Name
Owned For
Owner Type
Purchase Details
Closed on
Jul 12, 2016
Sold by
Jacobson Richard W and Jacobson Mary Ellen
Bought by
Jacobson Richard W
Current Estimated Value
Purchase Details
Closed on
Nov 1, 2013
Sold by
Vanarsdale Richard
Bought by
Jacobson Richard W and Jacobson Mary Ellen
Purchase Details
Closed on
Mar 4, 2011
Sold by
Duques David A
Bought by
Vanarsdale Richard
Purchase Details
Closed on
Nov 5, 2008
Sold by
Us Bank Na
Bought by
Duques David A
Purchase Details
Closed on
Oct 1, 2008
Sold by
Pierce Kelly and Case #07-3706 Ca
Bought by
Us Bank Na and Home Equity Asset Trust 2007-3 Home Equi
Purchase Details
Closed on
Nov 2, 2005
Sold by
Pierce Tony and Pierce Kelly
Bought by
Pierce Kelly
Purchase Details
Closed on
May 25, 2005
Sold by
Endres Gene
Bought by
Pierce Tony and Pierce Kelly
Purchase Details
Closed on
Dec 10, 1996
Sold by
Neil Marilyn D
Bought by
Neil Marilyn D and Endres Gene
Create a Home Valuation Report for This Property
The Home Valuation Report is an in-depth analysis detailing your home's value as well as a comparison with similar homes in the area
Home Values in the Area
Average Home Value in this Area
Purchase History
| Date | Buyer | Sale Price | Title Company |
|---|---|---|---|
| Jacobson Richard W | -- | None Available | |
| Jacobson Richard W | $90,000 | Burnt Store Title & Escrow L | |
| Vanarsdale Richard | $75,000 | Burnt Store Title & Escrow L | |
| Duques David A | $68,000 | Albertelli Title Inc | |
| Us Bank Na | -- | Attorney | |
| Pierce Kelly | -- | -- | |
| Pierce Tony | $45,000 | Safetitle Company | |
| Neil Marilyn D | -- | -- |
Source: Public Records
Tax History Compared to Growth
Tax History
| Year | Tax Paid | Tax Assessment Tax Assessment Total Assessment is a certain percentage of the fair market value that is determined by local assessors to be the total taxable value of land and additions on the property. | Land | Improvement |
|---|---|---|---|---|
| 2023 | $1,484 | $88,771 | $0 | $0 |
| 2022 | $1,407 | $86,185 | $0 | $0 |
| 2021 | $1,386 | $83,675 | $0 | $0 |
| 2020 | $1,342 | $82,520 | $0 | $0 |
| 2019 | $1,259 | $80,665 | $0 | $0 |
| 2018 | $1,140 | $79,161 | $0 | $0 |
| 2017 | $1,121 | $77,533 | $0 | $0 |
| 2016 | $1,106 | $75,938 | $0 | $0 |
| 2015 | $1,088 | $75,410 | $0 | $0 |
| 2014 | $1,567 | $65,000 | $0 | $0 |
Source: Public Records
Map
Nearby Homes
- 330 Weber Terrace
- 4198 Gardner Dr
- 370 Weber Terrace
- 4213 Gardner Dr
- 4238 Gardner Dr
- 551 Lindley Terrace
- 4158 Tamiami Trail Unit S6
- 4158 Tamiami Trail Unit G1
- 4158 Tamiami Trail Unit 6
- 4158 Tamiami Trail Unit E5
- 4158 Tamiami Trail Unit U6
- 4158 Tamiami Trail Unit G2
- 4158 Tamiami Trail Unit Q2
- 4158 Tamiami Trail Unit U4
- 4158 Tamiami Trail Unit B1
- 4158 Tamiami Trail Unit B3
- 4158 Tamiami Trail Unit P1
- 4158 Tamiami Trail Unit H2
- 4158 Tamiami Trail Unit M5
- 581 Lindley Terrace
- 4102 Gardner Dr
- 4118 Drive
- 4094 Gardner Dr
- 4126 Gardner Dr
- 4117 Gardner Dr
- 4086 Gardner Dr
- 4127 Gardner Dr
- 4101 Gardner Dr
- 4134 Gardner Dr
- 210 Mentel Terrace
- 210 Terrace
- 4135 Gardner Dr
- 4078 Gardner Dr
- 4142 Gardner Dr
- 4091 Gardner Dr
- 221 Mentel Terrace
- 4145 Gardner Dr
- 220 Mentel Terrace
- 311 Weber Terrace