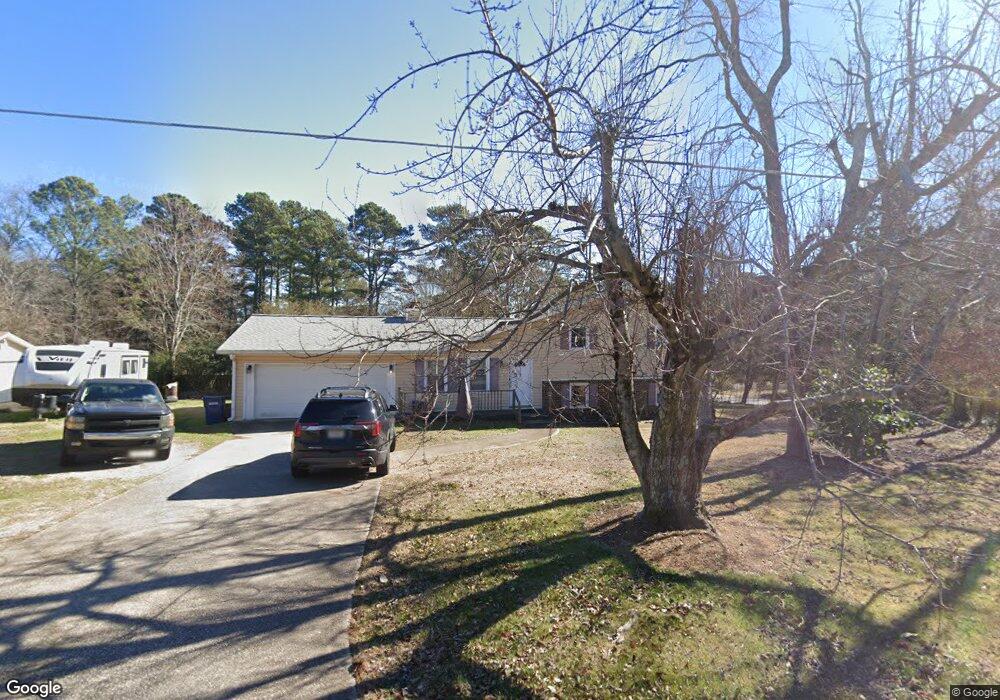
4110 Macduff Dr Unit 1 Douglasville, GA 30135
Anneewakee NeighborhoodEstimated Value: $258,381 - $312,000
3
Beds
2
Baths
1,505
Sq Ft
$184/Sq Ft
Est. Value
About This Home
This home is located at 4110 Macduff Dr Unit 1, Douglasville, GA 30135 and is currently estimated at $277,345, approximately $184 per square foot. 4110 Macduff Dr Unit 1 is a home located in Douglas County with nearby schools including Dorsett Shoals Elementary School, Yeager Middle School, and Chapel Hill High School.
Ownership History
Date
Name
Owned For
Owner Type
Purchase Details
Closed on
Jan 21, 2022
Sold by
Murray Greg A
Bought by
Murray Gregory Jacob and Kemppainen Jessica Diane
Current Estimated Value
Home Financials for this Owner
Home Financials are based on the most recent Mortgage that was taken out on this home.
Original Mortgage
$100,000
Outstanding Balance
$92,294
Interest Rate
3.22%
Mortgage Type
New Conventional
Estimated Equity
$185,051
Purchase Details
Closed on
Jul 28, 2006
Sold by
Horsley Joseph
Bought by
Murray Greg A
Home Financials for this Owner
Home Financials are based on the most recent Mortgage that was taken out on this home.
Original Mortgage
$127,150
Interest Rate
6.68%
Mortgage Type
VA
Purchase Details
Closed on
Feb 25, 1999
Sold by
Pelfrey Charles S and Pelfrey Sherry
Bought by
Rice Chet L
Home Financials for this Owner
Home Financials are based on the most recent Mortgage that was taken out on this home.
Original Mortgage
$88,300
Interest Rate
7.13%
Mortgage Type
New Conventional
Create a Home Valuation Report for This Property
The Home Valuation Report is an in-depth analysis detailing your home's value as well as a comparison with similar homes in the area
Home Values in the Area
Average Home Value in this Area
Purchase History
| Date | Buyer | Sale Price | Title Company |
|---|---|---|---|
| Murray Gregory Jacob | $125,000 | None Listed On Document | |
| Murray Greg A | $124,500 | -- | |
| Rice Chet L | $84,000 | -- |
Source: Public Records
Mortgage History
| Date | Status | Borrower | Loan Amount |
|---|---|---|---|
| Open | Murray Gregory Jacob | $100,000 | |
| Previous Owner | Murray Greg A | $127,150 | |
| Previous Owner | Rice Chet L | $88,300 |
Source: Public Records
Tax History Compared to Growth
Tax History
| Year | Tax Paid | Tax Assessment Tax Assessment Total Assessment is a certain percentage of the fair market value that is determined by local assessors to be the total taxable value of land and additions on the property. | Land | Improvement |
|---|---|---|---|---|
| 2024 | $2,577 | $105,440 | $16,400 | $89,040 |
| 2023 | $2,577 | $67,520 | $14,200 | $53,320 |
| 2022 | $1,702 | $67,520 | $14,200 | $53,320 |
| 2021 | $1,728 | $58,560 | $10,000 | $48,560 |
| 2020 | $1,760 | $58,560 | $10,000 | $48,560 |
| 2019 | $1,622 | $56,800 | $10,000 | $46,800 |
| 2018 | $1,400 | $48,240 | $8,680 | $39,560 |
| 2017 | $1,276 | $43,520 | $8,680 | $34,840 |
| 2016 | $1,657 | $55,440 | $11,440 | $44,000 |
| 2015 | $1,536 | $49,960 | $10,560 | $39,400 |
| 2014 | $1,338 | $43,160 | $9,760 | $33,400 |
| 2013 | -- | $36,160 | $8,160 | $28,000 |
Source: Public Records
Map
Nearby Homes
- 4092 Yeager Rd
- 4028 N Quail Dr
- 3990 N Quail Dr
- 5804 MacEdin Dr
- 4025 N Quail Dr
- 5725 MacEdin Dr
- 5744 Amalfi Way
- 5670 Bob White Ln
- 5287 Yeager Rd
- 5609 Twin Oak Dr
- 4100 Kings Hwy
- 0B Charley Dr
- 2266 Linden Pass
- 2280 Linden Pass
- 2270 Linden Pass
- 2278 Linden Pass
- 2286 Linden Pass
- 5492 Twin Oak Dr
- 5825 N Bear Dr
- 4044 Yeager Rd
- 4100 Macduff Dr
- 4105 Macduff Dr
- 4091 Macduff Dr
- 4054 Yeager Rd
- 4021 Yeager Rd
- 4031 Yeager Rd
- 4933 S Bent Pine Ct
- 4090 Macduff Dr Unit 2
- 4005 Yeager Rd
- 4065 N Bent Pine Ct
- 4041 Yeager Rd
- 4000 Yeager Rd
- 4064 Yeager Rd
- N N Bent Pine Ct
- 3995 Yeager Rd Unit 2
- 4923 S Bent Pine Ct
- 4049 N Bent Pine Ct Unit 2
- S S Bent Pine Ct
- 4051 Yeager Rd