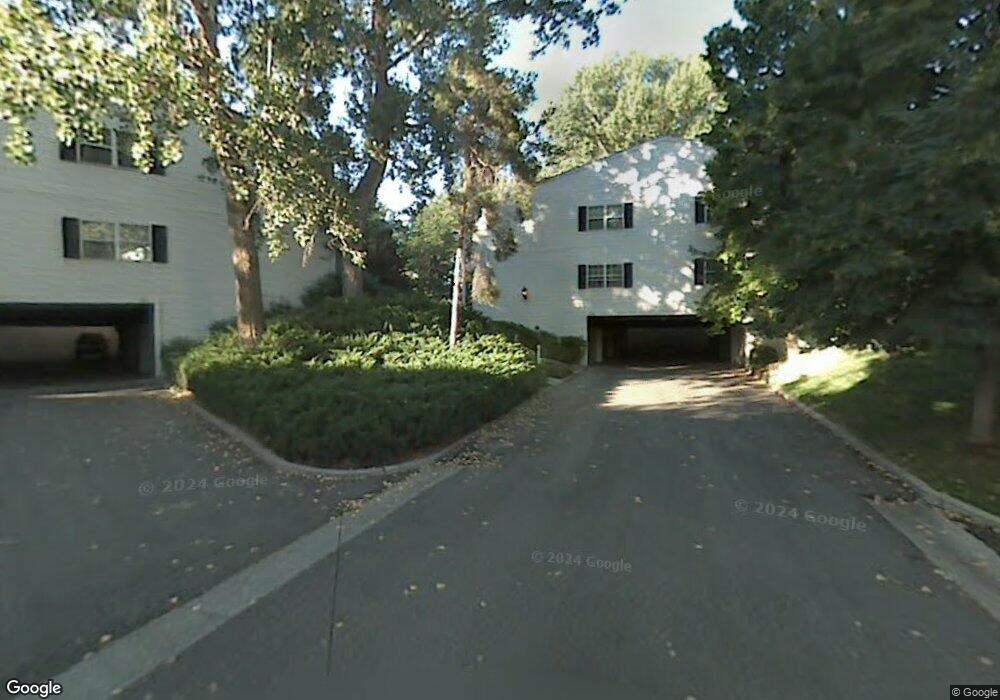
4110 S 670 E Unit G Salt Lake City, UT 84107
Estimated Value: $376,000 - $398,000
2
Beds
2
Baths
1,320
Sq Ft
$293/Sq Ft
Est. Value
About This Home
This home is located at 4110 S 670 E Unit G, Salt Lake City, UT 84107 and is currently estimated at $386,611, approximately $292 per square foot. 4110 S 670 E Unit G is a home located in Salt Lake County with nearby schools including James E Moss Elementary School, Bonneville Junior High School, and Cottonwood High School.
Ownership History
Date
Name
Owned For
Owner Type
Purchase Details
Closed on
Mar 30, 2011
Sold by
Fannie Mae
Bought by
Kimball David M
Current Estimated Value
Purchase Details
Closed on
Jan 20, 2011
Sold by
Gmac Mortgage Llc
Bought by
Federal National Mortgage Association
Purchase Details
Closed on
Nov 18, 2010
Sold by
Stratton Janice
Bought by
Gmac Mortgage Llc
Purchase Details
Closed on
Aug 18, 2000
Sold by
Stratton Janice A and Stratton Janice
Bought by
Stratton Janice
Home Financials for this Owner
Home Financials are based on the most recent Mortgage that was taken out on this home.
Original Mortgage
$35,000
Interest Rate
8.15%
Mortgage Type
Credit Line Revolving
Purchase Details
Closed on
Jul 3, 1997
Sold by
Sanborn Carol Lee and Sanborn Thomas L
Bought by
Stratton Janice A
Home Financials for this Owner
Home Financials are based on the most recent Mortgage that was taken out on this home.
Original Mortgage
$86,800
Interest Rate
7.92%
Create a Home Valuation Report for This Property
The Home Valuation Report is an in-depth analysis detailing your home's value as well as a comparison with similar homes in the area
Home Values in the Area
Average Home Value in this Area
Purchase History
| Date | Buyer | Sale Price | Title Company |
|---|---|---|---|
| Kimball David M | $127,500 | United Title Services | |
| Federal National Mortgage Association | -- | Trustees Title & Escrow Lc | |
| Gmac Mortgage Llc | $149,536 | Trustees Title & Escrow Lc | |
| Stratton Janice | -- | Surety Title Agency | |
| Stratton Janice A | -- | -- |
Source: Public Records
Mortgage History
| Date | Status | Borrower | Loan Amount |
|---|---|---|---|
| Previous Owner | Stratton Janice | $35,000 | |
| Previous Owner | Stratton Janice A | $86,800 |
Source: Public Records
Tax History Compared to Growth
Tax History
| Year | Tax Paid | Tax Assessment Tax Assessment Total Assessment is a certain percentage of the fair market value that is determined by local assessors to be the total taxable value of land and additions on the property. | Land | Improvement |
|---|---|---|---|---|
| 2025 | $2,127 | $333,300 | $100,000 | $233,300 |
| 2024 | $2,127 | $331,200 | $99,300 | $231,900 |
| 2023 | $2,109 | $316,700 | $95,000 | $221,700 |
| 2022 | $2,041 | $308,700 | $92,600 | $216,100 |
| 2021 | $1,895 | $248,400 | $74,500 | $173,900 |
| 2020 | $1,803 | $223,500 | $67,000 | $156,500 |
| 2019 | $1,676 | $202,800 | $60,800 | $142,000 |
| 2018 | $1,676 | $195,300 | $58,600 | $136,700 |
| 2017 | $1,449 | $176,700 | $53,000 | $123,700 |
| 2016 | $1,357 | $167,400 | $50,200 | $117,200 |
| 2015 | $1,381 | $159,400 | $47,800 | $111,600 |
| 2014 | $1,397 | $157,800 | $47,300 | $110,500 |
Source: Public Records
Map
Nearby Homes
- 689 E 4149 S
- 657 E 4065 S Unit C
- 4178 S 650 E
- 4040 S 685 E Unit F
- 4040 S 685 E Unit F
- 651 E 4025 S Unit G
- 607 E 4030 S
- 665 E 4025 S Unit H
- 4247 S 615 E
- 584 E 3990 S
- 635 E 4025 S Unit C
- 4264 S Steele Creek Ct
- 495 E Mary Rose Dr
- 779 E 4070 S
- 830 E Grand Cayman Dr
- 4289 S 730 E
- 4325 S Park St E
- 842 E 4170 S
- 832 E 4170 S
- 838 E 4170 S
- 4110 S 670 E Unit E
- 4110 S 670 E Unit H
- 4110 S 670 E Unit F
- 4108 S 670 E Unit D
- 4108 S 670 E Unit A
- 4108 S 670 E Unit C
- 4108 S 670 E Unit B
- 4108 S 670 E
- 4105 S 670 E Unit H
- 4105 S 670 E Unit E
- 4105 S 670 E Unit G
- 4105 S 670 E Unit F
- 4105 S 670 E Unit 255 G
- 646 E 4065 S Unit D
- 646 E 4065 S Unit A
- 646 E 4065 S Unit C
- 646 E 4065 S Unit B
- 4090 S 670 E Unit B
- 4090 S 670 E Unit D
- 4090 S 670 E Unit C