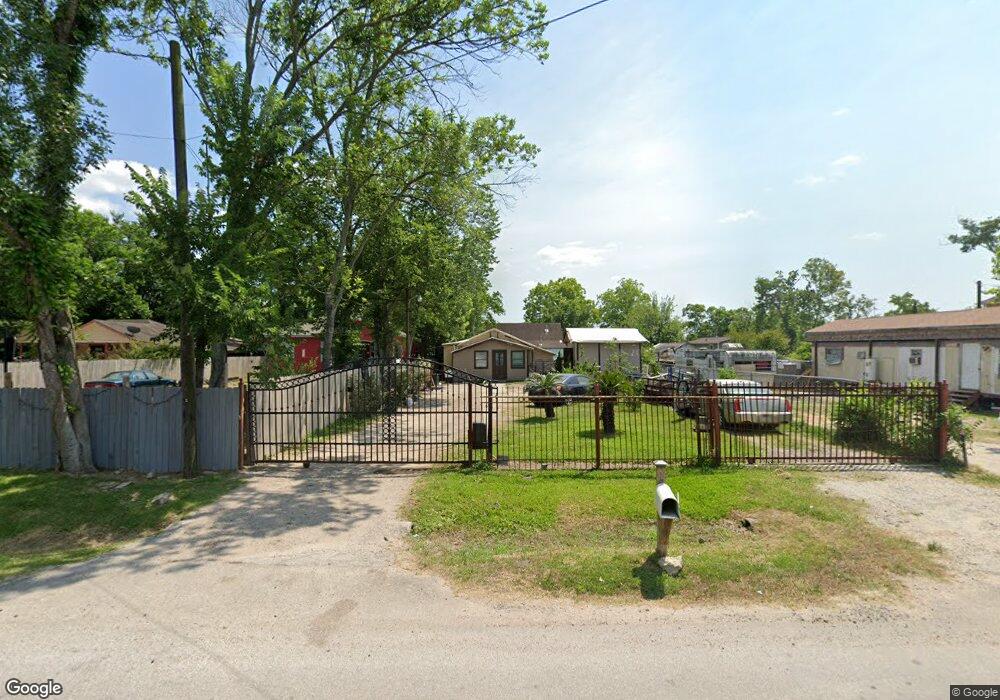
4110 Trenton Rd Houston, TX 77093
East Aldine NeighborhoodEstimated Value: $128,456 - $177,000
2
Beds
1
Bath
1,480
Sq Ft
$108/Sq Ft
Est. Value
About This Home
This home is located at 4110 Trenton Rd, Houston, TX 77093 and is currently estimated at $159,114, approximately $107 per square foot. 4110 Trenton Rd is a home located in Harris County with nearby schools including Escamilla Elementary School, Macarthur Ninth Grade School, and Hambrick Middle School.
Ownership History
Date
Name
Owned For
Owner Type
Purchase Details
Closed on
May 25, 2004
Sold by
Moore Audrey Pauline Tucker and Moore Polly
Bought by
Sauceda Francisco and Sauceda Francisca
Current Estimated Value
Home Financials for this Owner
Home Financials are based on the most recent Mortgage that was taken out on this home.
Original Mortgage
$35,000
Outstanding Balance
$16,905
Interest Rate
5.93%
Mortgage Type
Seller Take Back
Estimated Equity
$142,209
Purchase Details
Closed on
Aug 29, 2002
Sold by
Estate Of Ronald Mac Moore
Bought by
Moore Audrey Pauline Tucker and Moore Polly
Purchase Details
Closed on
May 15, 1996
Sold by
Wilson Gladys Tucker and Smith Frances Tucker
Bought by
Moore Audrey Pauline Tucker and Moore Ron
Purchase Details
Closed on
Dec 10, 1993
Sold by
Christal Inez
Bought by
Mayes Betty
Create a Home Valuation Report for This Property
The Home Valuation Report is an in-depth analysis detailing your home's value as well as a comparison with similar homes in the area
Home Values in the Area
Average Home Value in this Area
Purchase History
| Date | Buyer | Sale Price | Title Company |
|---|---|---|---|
| Sauceda Francisco | -- | -- | |
| Moore Audrey Pauline Tucker | -- | -- | |
| Moore Audrey Pauline Tucker | -- | -- | |
| Wilson Gladys Tucker | -- | -- | |
| Estate Of Lola Tucker Hagan | -- | -- | |
| Mayes Betty | -- | -- |
Source: Public Records
Mortgage History
| Date | Status | Borrower | Loan Amount |
|---|---|---|---|
| Open | Sauceda Francisco | $35,000 |
Source: Public Records
Tax History Compared to Growth
Tax History
| Year | Tax Paid | Tax Assessment Tax Assessment Total Assessment is a certain percentage of the fair market value that is determined by local assessors to be the total taxable value of land and additions on the property. | Land | Improvement |
|---|---|---|---|---|
| 2025 | $1,638 | $113,992 | $26,250 | $87,742 |
| 2024 | $1,638 | $84,686 | $26,250 | $58,436 |
| 2023 | $1,638 | $80,799 | $26,250 | $54,549 |
| 2022 | $1,415 | $68,808 | $15,000 | $53,808 |
| 2021 | $760 | $35,250 | $13,500 | $21,750 |
| 2020 | $801 | $35,250 | $13,500 | $21,750 |
| 2019 | $839 | $35,250 | $13,500 | $21,750 |
| 2018 | $506 | $35,250 | $13,500 | $21,750 |
| 2017 | $799 | $35,250 | $13,500 | $21,750 |
| 2016 | $799 | $35,250 | $13,500 | $21,750 |
| 2015 | $786 | $35,250 | $13,500 | $21,750 |
| 2014 | $786 | $35,250 | $13,500 | $21,750 |
Source: Public Records
Map
Nearby Homes
- 4410 Shelton Rd
- 3804 Cedar Hill Ln
- 11206 Eastex Fwy
- 4415 Mooney Rd
- 3418 Hopper Rd
- 4918 Langley Rd
- 4007 Wedgewood St
- 4809 Edgewater Dr
- 1904 Little York Rd
- 4509 Haywood St
- 9213 Washington St
- 3214 Brea Crest St
- 5022 Bretshire Dr
- 1728 Little York Rd
- 5130 Farb Dr
- 11375 Allwood St
- 5123 Francine Ln
- 2817 Cromwell St
- 5611 Yorkwood St
- 5413 Glen Nook Dr
- 4114 Trenton Rd
- 4102 Trenton Rd
- 4118 Trenton Rd
- 4022 Trenton Rd
- 4109 Darwin St
- 4105 Darwin St
- 4113 Darwin St
- 4101 Darwin St
- 4126 Trenton Rd
- 4121 Darwin St
- 4018 Trenton Rd
- 4101 Trenton Rd
- 4125 Darwin St
- 4023 Trenton Rd
- 4019 Darwin St
- 4123 Trenton Rd
- 4019 Trenton Rd
- 4127 Trenton Rd
- 4015 Trenton Rd
- 4015 Darwin St