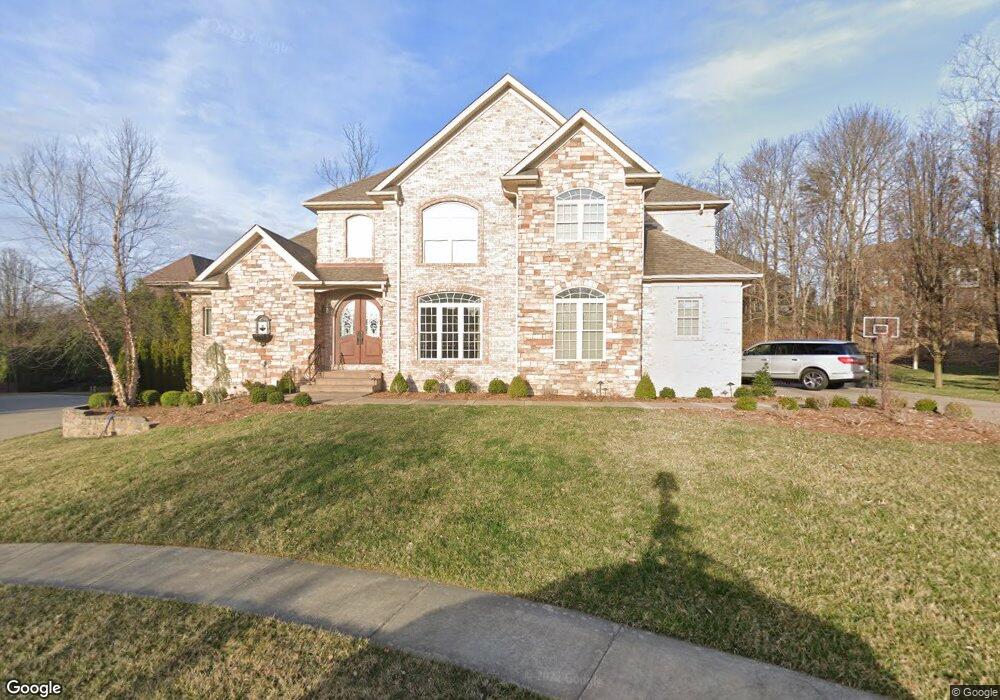
4110 Versailles Ct Floyds Knobs, IN 47119
Floyds Knobs NeighborhoodEstimated Value: $670,000 - $749,122
4
Beds
5
Baths
4,862
Sq Ft
$145/Sq Ft
Est. Value
About This Home
This home is located at 4110 Versailles Ct, Floyds Knobs, IN 47119 and is currently estimated at $705,531, approximately $145 per square foot. 4110 Versailles Ct is a home located in Floyd County with nearby schools including Floyds Knobs Elementary School, Highland Hills Middle School, and Floyd Central High School.
Ownership History
Date
Name
Owned For
Owner Type
Purchase Details
Closed on
Mar 29, 2011
Sold by
Gream James and Gream Emily
Bought by
Pfaffenberger Philip A and Pfaffenberger Laura J
Current Estimated Value
Home Financials for this Owner
Home Financials are based on the most recent Mortgage that was taken out on this home.
Original Mortgage
$344,000
Outstanding Balance
$240,520
Interest Rate
5.09%
Mortgage Type
New Conventional
Estimated Equity
$465,011
Purchase Details
Closed on
Jan 17, 2006
Sold by
A A Properties Inc and Witten Kent D
Bought by
Grean James
Home Financials for this Owner
Home Financials are based on the most recent Mortgage that was taken out on this home.
Original Mortgage
$108,000
Interest Rate
6.37%
Mortgage Type
Stand Alone Second
Purchase Details
Closed on
Jan 6, 2005
Sold by
Wind Dance Farm Inc
Bought by
Aa Properties Inc
Home Financials for this Owner
Home Financials are based on the most recent Mortgage that was taken out on this home.
Original Mortgage
$394,400
Interest Rate
5.78%
Mortgage Type
Purchase Money Mortgage
Create a Home Valuation Report for This Property
The Home Valuation Report is an in-depth analysis detailing your home's value as well as a comparison with similar homes in the area
Home Values in the Area
Average Home Value in this Area
Purchase History
| Date | Buyer | Sale Price | Title Company |
|---|---|---|---|
| Pfaffenberger Philip A | -- | None Available | |
| Grean James | $540,000 | None Available | |
| Aa Properties Inc | -- | None Available |
Source: Public Records
Mortgage History
| Date | Status | Borrower | Loan Amount |
|---|---|---|---|
| Open | Pfaffenberger Philip A | $344,000 | |
| Previous Owner | Grean James | $108,000 | |
| Previous Owner | Aa Properties Inc | $394,400 |
Source: Public Records
Tax History
| Year | Tax Paid | Tax Assessment Tax Assessment Total Assessment is a certain percentage of the fair market value that is determined by local assessors to be the total taxable value of land and additions on the property. | Land | Improvement |
|---|---|---|---|---|
| 2024 | $5,595 | $613,200 | $80,400 | $532,800 |
| 2023 | $6,118 | $628,500 | $80,400 | $548,100 |
| 2022 | $5,177 | $539,600 | $80,400 | $459,200 |
| 2021 | $4,834 | $506,200 | $80,400 | $425,800 |
| 2020 | $4,355 | $469,000 | $80,400 | $388,600 |
| 2019 | $4,686 | $508,100 | $80,400 | $427,700 |
| 2018 | $4,665 | $509,800 | $80,400 | $429,400 |
| 2017 | $4,361 | $460,200 | $80,400 | $379,800 |
| 2016 | $3,769 | $443,600 | $80,400 | $363,200 |
| 2014 | $3,482 | $386,500 | $81,300 | $305,200 |
| 2013 | -- | $394,800 | $81,300 | $313,500 |
Source: Public Records
Map
Nearby Homes
- 4036 Marquette Dr
- 4038 Marquette Dr
- 4008 Marquette Dr
- 4006 Marquette Dr
- 3524 Lafayette Pkwy
- 3705 Mirville Ct
- 3704 Mirville Ct
- 4030 Marquette Dr
- 2605 W Deville Ct
- Lot 1 Jones Ln
- 3720 Flemar Dr
- 3913 Paoli Pike
- 5200 Scottsville Rd
- 3018 Sieveking Rd
- 113 Farrington Dr
- 3427 Greenview Dr
- 3035 Masters Dr
- 3019 Masters Dr
- 3014 Masters Dr
- 112 Cheryl Dr
- 4108 Versailles Ct
- 4403 St Paul Devence Ct
- 4112 Versailles Ct
- 4403 Saint Paul Devence
- 4106 Versailles Ct
- 4114 Versailles Ct
- 4113 Versailles Ct
- 4019 Marquette Dr
- 4111 Versailles Ct
- 4407 Saint Paul Devence
- 4017 Marquette Dr
- 4104 Versailles Ct
- 4109 Versailles Ct
- 4404 Saint Paul Devence
- 4015 Marquette Dr
- 4102 Versailles Ct
- 4107 Versailles Ct
- 4409 Saint Paul Devence
- 4013 Marquette Dr
- 4406 Saint Paul Devence
Your Personal Tour Guide
Ask me questions while you tour the home.