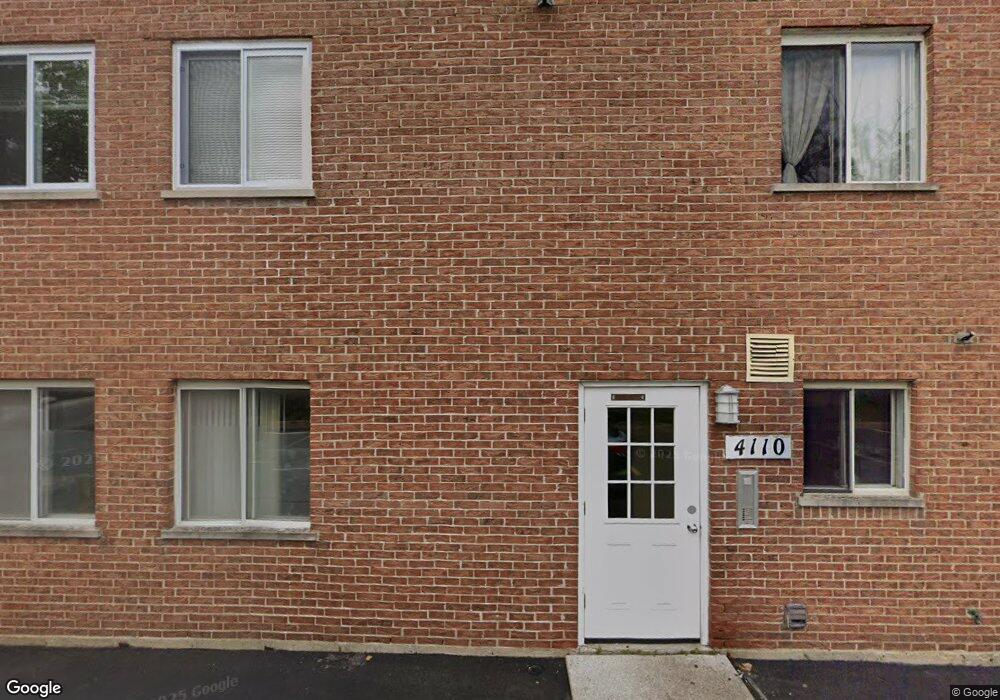
4110 Williamsburg Ct Unit 4110 Glenview, IL 60025
Estimated Value: $277,000 - $948,267
1
Bed
--
Bath
694
Sq Ft
$1,089/Sq Ft
Est. Value
About This Home
This home is located at 4110 Williamsburg Ct Unit 4110, Glenview, IL 60025 and is currently estimated at $756,067, approximately $1,089 per square foot. 4110 Williamsburg Ct Unit 4110 is a home located in Cook County with nearby schools including Henking Elementary School, Hoffman Elementary School, and Springman Middle School.
Ownership History
Date
Name
Owned For
Owner Type
Purchase Details
Closed on
Feb 10, 2022
Sold by
Kaszubski Waldemar and Kaszubski Krystyna
Bought by
Pitkin Enterprises Ltd
Current Estimated Value
Home Financials for this Owner
Home Financials are based on the most recent Mortgage that was taken out on this home.
Original Mortgage
$570,000
Outstanding Balance
$143,354
Interest Rate
4%
Estimated Equity
$612,713
Purchase Details
Closed on
Oct 9, 2019
Sold by
Kaszubski Waldemar and Kaszubski Krystyna
Bought by
Kaszubski Waldemar and Kaszubski Krystyna
Purchase Details
Closed on
Mar 13, 1996
Sold by
Nicolaou James A and Nicolaou Vouta
Bought by
Kaszubski Waldemar and Kaszubski Krystina
Create a Home Valuation Report for This Property
The Home Valuation Report is an in-depth analysis detailing your home's value as well as a comparison with similar homes in the area
Home Values in the Area
Average Home Value in this Area
Purchase History
| Date | Buyer | Sale Price | Title Company |
|---|---|---|---|
| Pitkin Enterprises Ltd | $760,000 | -- | |
| Pitkin Enterprises Ltd | $760,000 | -- | |
| Kaszubski Waldemar | -- | None Available | |
| Kaszubski Waldemar | $404,000 | -- |
Source: Public Records
Mortgage History
| Date | Status | Borrower | Loan Amount |
|---|---|---|---|
| Open | Pitkin Enterprises Ltd | $570,000 |
Source: Public Records
Tax History
| Year | Tax Paid | Tax Assessment Tax Assessment Total Assessment is a certain percentage of the fair market value that is determined by local assessors to be the total taxable value of land and additions on the property. | Land | Improvement |
|---|---|---|---|---|
| 2025 | $14,103 | $81,111 | $10,911 | $70,200 |
| 2024 | $14,103 | $66,330 | $9,232 | $57,098 |
| 2023 | $13,462 | $66,330 | $9,232 | $57,098 |
| 2022 | $13,462 | $66,330 | $9,232 | $57,098 |
| 2021 | $12,859 | $54,478 | $6,294 | $48,184 |
| 2020 | $12,824 | $54,478 | $6,294 | $48,184 |
| 2019 | $11,965 | $60,378 | $6,294 | $54,084 |
| 2018 | $10,749 | $48,768 | $5,455 | $43,313 |
| 2017 | $10,452 | $48,768 | $5,455 | $43,313 |
| 2016 | $9,852 | $48,768 | $5,455 | $43,313 |
| 2015 | $10,668 | $47,023 | $4,406 | $42,617 |
| 2014 | $10,419 | $47,023 | $4,406 | $42,617 |
| 2013 | $11,357 | $52,728 | $4,406 | $48,322 |
Source: Public Records
Map
Nearby Homes
- 9517 W Central Rd
- 4188 Cove Ln Unit F
- 701 Forum Square Unit 102
- 10467 Dearlove Rd Unit 6
- 3700 Capri Ct Unit 510
- 3700 Capri Ct Unit 308
- 3801 Appian Way Unit 403
- 3732 Capri Ct Unit T18A
- 206 Country Ln Unit 206
- 9375 Hamilton Ct Unit E
- 9600 S Lyman Ave
- 1002 Castilian Ct Unit B302
- 9630 Reding Cir
- 1026 Castilian Ct Unit D162
- 9802 Bianco Terrace Unit 1A
- 9078 W Heathwood Dr Unit 5
- 9078 W Heathwood Dr Unit 1M
- 9701 N Dee Rd Unit 5E
- 9701 N Dee Rd Unit 6M
- 9128 W Dr
- 4110 Williamsburg Ct
- 4120 Williamsburg Ct Unit 4120
- 4100 Williamsburg Ct Unit 4100
- 4111 Williamsburg Ct Unit 4111
- 4121 Williamsburg Ct Unit 4121
- 4131 Williamsburg Ct
- 4131 Williamsburg Ct Unit 4131
- 4130 Williamsburg Ct Unit 4130
- 4150 Williamsburg Ct Unit 102
- 4150 Williamsburg Ct Unit 101
- 4150 Williamsburg Ct Unit 4150
- 4150 Williamsburg Ct Unit 302
- 4150 Williamsburg Ct Unit 201
- 4150 Williamsburg Ct Unit 202
- 4141 Williamsburg Ct Unit 4141
- 4141 Williamsburg Ct Unit 302
- 4141 Williamsburg Ct Unit 301
- 4141 Williamsburg Ct Unit 102
- 4141 Williamsburg Ct
- 4141 Williamsburg Ct Unit 201
Your Personal Tour Guide
Ask me questions while you tour the home.