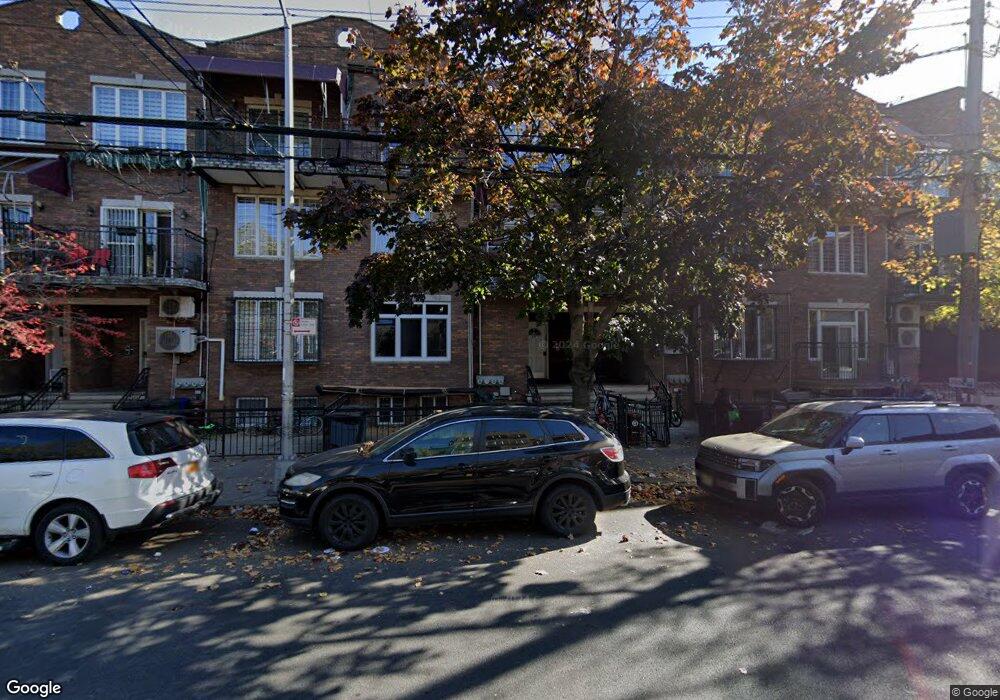
4111 12th Ave Unit 3C Brooklyn, NY 11219
Borough Park NeighborhoodEstimated Value: $980,000 - $1,249,000
Studio
--
Bath
1,422
Sq Ft
$801/Sq Ft
Est. Value
About This Home
This home is located at 4111 12th Ave Unit 3C, Brooklyn, NY 11219 and is currently estimated at $1,139,644, approximately $801 per square foot. 4111 12th Ave Unit 3C is a home located in Kings County with nearby schools including P.S. 131 Brooklyn, I.S. 223 The Montauk, and Franklin Delano Roosevelt High School.
Ownership History
Date
Name
Owned For
Owner Type
Purchase Details
Closed on
May 10, 2018
Sold by
Pinches Kaff Trustee
Bought by
Kaff Idy and Kaff Pinchus
Current Estimated Value
Home Financials for this Owner
Home Financials are based on the most recent Mortgage that was taken out on this home.
Original Mortgage
$547,500
Outstanding Balance
$471,416
Interest Rate
4.4%
Mortgage Type
Purchase Money Mortgage
Estimated Equity
$668,228
Purchase Details
Closed on
May 22, 2017
Sold by
The Reich Mishpacha Trust
Bought by
Pinches Kaff Trustee and Sh 5-17 Trust
Purchase Details
Closed on
Sep 18, 2014
Sold by
Reich Naftali
Bought by
Reich As Trustee Zvi and The Reich Mishpacha Trust
Purchase Details
Closed on
Apr 1, 2014
Sold by
Reich Zvi
Bought by
Reich Naftali
Purchase Details
Closed on
Oct 1, 2013
Sold by
Reich Naftali
Bought by
Reich Zvi and The Reich Mishpacha Trust
Purchase Details
Closed on
Mar 17, 2009
Sold by
Reich Naftoli
Bought by
Reich Naftoli
Purchase Details
Closed on
Dec 13, 1994
Sold by
12Th Avenue & 42Nd Street Corp
Bought by
Reich Naftoli and Reich Rivky
Create a Home Valuation Report for This Property
The Home Valuation Report is an in-depth analysis detailing your home's value as well as a comparison with similar homes in the area
Home Values in the Area
Average Home Value in this Area
Purchase History
| Date | Buyer | Sale Price | Title Company |
|---|---|---|---|
| Kaff Idy | -- | -- | |
| Pinches Kaff Trustee | -- | -- | |
| Reich As Trustee Zvi | -- | -- | |
| Reich Naftali | -- | -- | |
| Reich Zvi | -- | -- | |
| Reich Naftoli | -- | -- | |
| Reich Naftoli | $213,000 | -- |
Source: Public Records
Mortgage History
| Date | Status | Borrower | Loan Amount |
|---|---|---|---|
| Open | Kaff Idy | $547,500 |
Source: Public Records
Tax History
| Year | Tax Paid | Tax Assessment Tax Assessment Total Assessment is a certain percentage of the fair market value that is determined by local assessors to be the total taxable value of land and additions on the property. | Land | Improvement |
|---|---|---|---|---|
| 2025 | $5,884 | $64,050 | $2,785 | $61,265 |
| 2024 | $5,884 | $54,620 | $2,785 | $51,835 |
| 2023 | $5,613 | $50,097 | $2,785 | $47,312 |
| 2022 | $5,205 | $46,179 | $2,785 | $43,394 |
| 2021 | $5,177 | $42,848 | $2,785 | $40,063 |
| 2020 | $2,573 | $42,545 | $2,785 | $39,760 |
| 2019 | $5,107 | $38,555 | $2,785 | $35,770 |
| 2018 | $4,695 | $23,030 | $1,790 | $21,240 |
| 2017 | $4,429 | $21,727 | $1,823 | $19,904 |
| 2016 | $4,098 | $20,498 | $1,595 | $18,903 |
| 2015 | $2,472 | $20,498 | $1,542 | $18,956 |
| 2014 | $2,472 | $20,343 | $1,693 | $18,650 |
Source: Public Records
Map
Nearby Homes
- 1258 41st St
- 1240 43rd St
- 1227 40th St
- 3809 12th Ave
- 1271 38th St
- 1243 37th St
- 1323 46th St Unit 5C
- 1012 41st St Unit 4
- 1026 39th St
- 4019 10th Ave
- 4107 New Utrecht Ave
- 4105 New Utrecht Ave
- 4709 New Utrecht Ave
- 4103 10th Ave
- 1025 45th St Unit 1D
- 1025 45th St Unit 3F
- 1012 39th St Unit 4A
- 3553 12th Ave
- 3545 12th Ave
- 4726 New Utrecht Ave
- 4109 12th Ave Unit 3C
- 4109 12th Ave Unit 2B
- 4109 12th Ave Unit 1A
- 4109 12th Ave
- 4107 12th Ave Unit 3C
- 4107 12th Ave Unit 2B
- 4107 12th Ave Unit 1A
- 4107 12th Ave
- 4111 12th Ave Unit 2B
- 4111 12th Ave Unit 1A
- 4111 12th Ave
- 4113 12th Ave Unit 3C
- 4113 12th Ave Unit 2B
- 4113 12th Ave Unit 1A
- 4113 12th Ave
- 4105 12th Ave Unit 3C
- 4105 12th Ave Unit 2B
- 4105 12th Ave Unit 1A
- 4105 12th Ave
- 1214 41st St
Your Personal Tour Guide
Ask me questions while you tour the home.