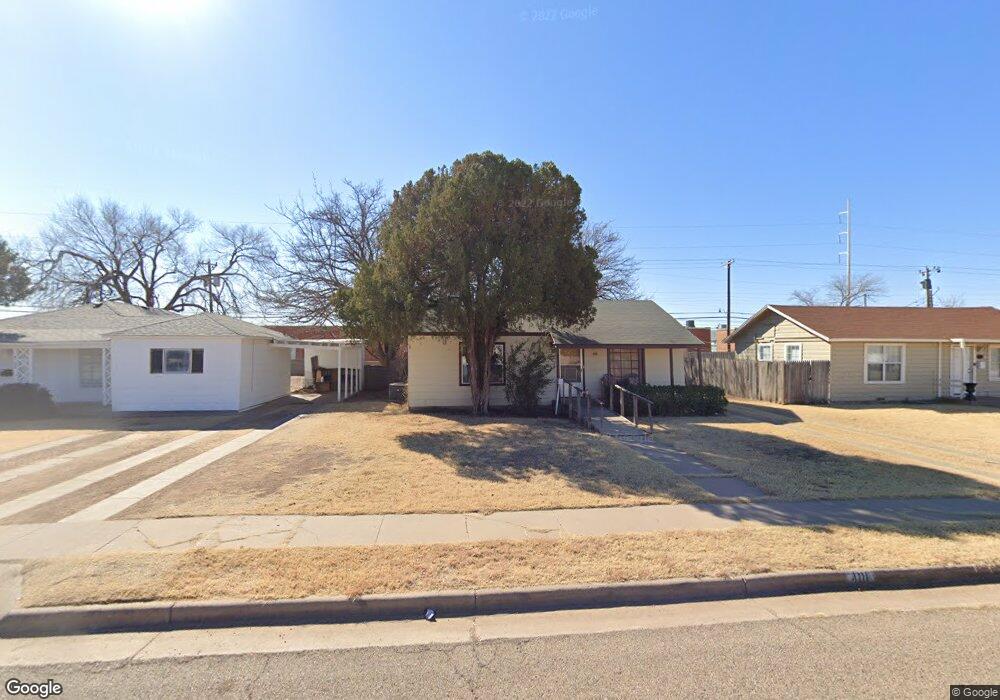
4111 33rd St Lubbock, TX 79410
Maxey Park NeighborhoodEstimated Value: $123,000 - $137,000
3
Beds
1
Bath
900
Sq Ft
$143/Sq Ft
Est. Value
About This Home
This home is located at 4111 33rd St, Lubbock, TX 79410 and is currently estimated at $128,936, approximately $143 per square foot. 4111 33rd St is a home located in Lubbock County with nearby schools including Overton Elementary School, Commander William C. McCool Academy, and Mackenzie Middle School.
Ownership History
Date
Name
Owned For
Owner Type
Purchase Details
Closed on
Jun 10, 2025
Sold by
Patterson Celeste
Bought by
Patterson Austin Cash
Current Estimated Value
Home Financials for this Owner
Home Financials are based on the most recent Mortgage that was taken out on this home.
Original Mortgage
$112,520
Outstanding Balance
$112,228
Interest Rate
6.76%
Mortgage Type
New Conventional
Estimated Equity
$16,708
Purchase Details
Closed on
Jul 5, 2024
Sold by
Abney Jess
Bought by
Patterson Celeste
Create a Home Valuation Report for This Property
The Home Valuation Report is an in-depth analysis detailing your home's value as well as a comparison with similar homes in the area
Home Values in the Area
Average Home Value in this Area
Purchase History
| Date | Buyer | Sale Price | Title Company |
|---|---|---|---|
| Patterson Austin Cash | -- | Western Title | |
| Patterson Celeste | -- | Western Title |
Source: Public Records
Mortgage History
| Date | Status | Borrower | Loan Amount |
|---|---|---|---|
| Open | Patterson Austin Cash | $112,520 |
Source: Public Records
Tax History Compared to Growth
Tax History
| Year | Tax Paid | Tax Assessment Tax Assessment Total Assessment is a certain percentage of the fair market value that is determined by local assessors to be the total taxable value of land and additions on the property. | Land | Improvement |
|---|---|---|---|---|
| 2025 | $292 | $115,127 | $23,500 | $91,627 |
| 2024 | $292 | $126,067 | $23,500 | $102,567 |
| 2023 | $304 | $87,897 | $10,065 | $97,553 |
| 2022 | $1,618 | $79,906 | $10,065 | $94,362 |
| 2021 | $1,556 | $72,642 | $10,065 | $62,577 |
| 2020 | $1,562 | $71,812 | $10,065 | $61,747 |
| 2019 | $1,621 | $72,227 | $10,065 | $62,162 |
| 2018 | $1,530 | $68,054 | $10,065 | $57,989 |
| 2017 | $1,392 | $61,867 | $10,065 | $51,802 |
| 2016 | $1,355 | $60,210 | $10,065 | $50,145 |
| 2015 | $407 | $56,343 | $10,065 | $46,278 |
| 2014 | $407 | $54,535 | $4,950 | $49,585 |
Source: Public Records
Map
Nearby Homes