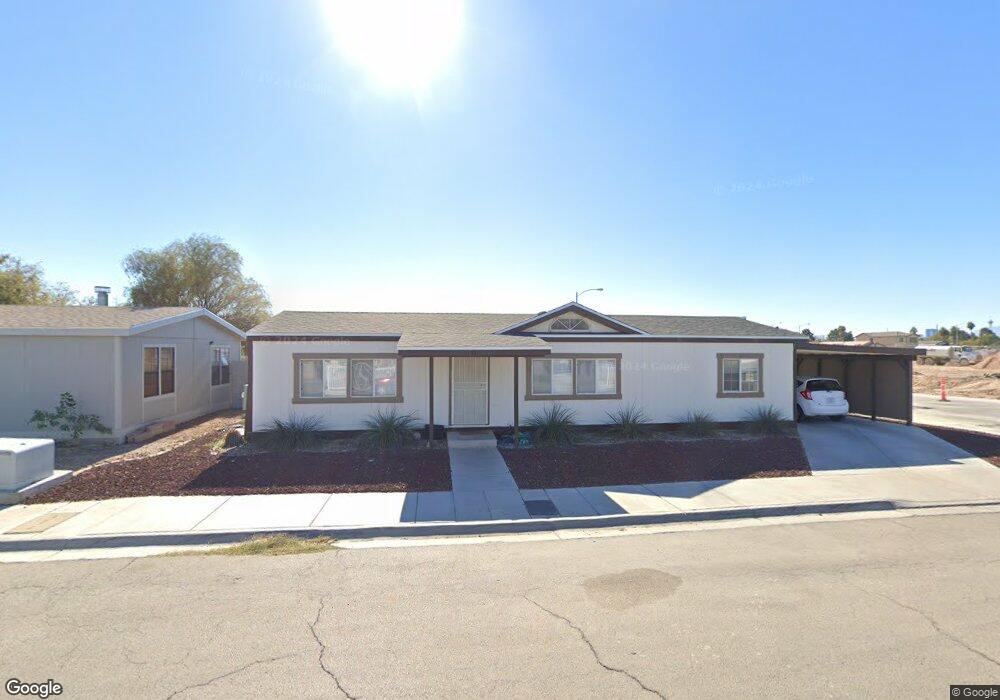
4111 Courage Ct Las Vegas, NV 89115
Estimated Value: $275,000 - $280,000
3
Beds
2
Baths
1,184
Sq Ft
$234/Sq Ft
Est. Value
About This Home
This home is located at 4111 Courage Ct, Las Vegas, NV 89115 and is currently estimated at $277,000, approximately $233 per square foot. 4111 Courage Ct is a home located in Clark County with nearby schools including Manuel J. Cortez Elementary School, Mario C. & Joanne Monaco Middle School, and Desert Pines High School.
Ownership History
Date
Name
Owned For
Owner Type
Purchase Details
Closed on
Feb 19, 2019
Sold by
Hartman Barbara
Bought by
Hartman Barbara and Smith Brttney Ann
Current Estimated Value
Purchase Details
Closed on
Feb 26, 2004
Sold by
Hartman Barbara
Bought by
Hartman Barbara
Home Financials for this Owner
Home Financials are based on the most recent Mortgage that was taken out on this home.
Original Mortgage
$119,059
Outstanding Balance
$55,448
Interest Rate
5.62%
Mortgage Type
FHA
Estimated Equity
$221,552
Purchase Details
Closed on
Dec 30, 2003
Sold by
Lehtinen Lincoln Corp
Bought by
Hartman Barbara
Home Financials for this Owner
Home Financials are based on the most recent Mortgage that was taken out on this home.
Original Mortgage
$119,059
Outstanding Balance
$55,448
Interest Rate
5.62%
Mortgage Type
FHA
Estimated Equity
$221,552
Create a Home Valuation Report for This Property
The Home Valuation Report is an in-depth analysis detailing your home's value as well as a comparison with similar homes in the area
Home Values in the Area
Average Home Value in this Area
Purchase History
| Date | Buyer | Sale Price | Title Company |
|---|---|---|---|
| Hartman Barbara | -- | Accommodation | |
| Hartman Barbara | -- | Ticor Title Of Nevada Inc | |
| Hartman Barbara | $49,000 | -- |
Source: Public Records
Mortgage History
| Date | Status | Borrower | Loan Amount |
|---|---|---|---|
| Open | Hartman Barbara | $119,059 |
Source: Public Records
Tax History Compared to Growth
Tax History
| Year | Tax Paid | Tax Assessment Tax Assessment Total Assessment is a certain percentage of the fair market value that is determined by local assessors to be the total taxable value of land and additions on the property. | Land | Improvement |
|---|---|---|---|---|
| 2025 | $764 | $53,708 | $19,250 | $34,458 |
| 2024 | $708 | $53,708 | $19,250 | $34,458 |
| 2023 | $708 | $49,668 | $17,500 | $32,168 |
| 2022 | $656 | $44,874 | $15,750 | $29,124 |
| 2021 | $607 | $39,859 | $12,250 | $27,609 |
| 2020 | $561 | $39,776 | $12,250 | $27,526 |
| 2019 | $526 | $36,826 | $9,800 | $27,026 |
| 2018 | $502 | $32,389 | $6,300 | $26,089 |
| 2017 | $812 | $27,695 | $5,075 | $22,620 |
| 2016 | $471 | $27,913 | $4,550 | $23,363 |
| 2015 | $469 | $19,394 | $3,500 | $15,894 |
| 2014 | $454 | $16,481 | $3,500 | $12,981 |
Source: Public Records
Map
Nearby Homes
- 4120 Courage Ct
- 4161 Terrestrial Ln
- 4057 Pioneer Ridge Ct
- 1962 Cosmic Dr
- 4132 Mark Twain Ct
- 4321 Stockbridge St
- 1680 Royal Estates Dr
- 4363 Pittsfield St
- 1618 Meno Peak St
- Heywood Plan at Parkhill Crest
- Drumlin Plan at Parkhill Crest
- Arroway Plan at Parkhill Crest
- 1570 Jamielinn Ln Unit 104
- 1683 Square Fields St
- 3904 Garden Square Ave
- 1560 Jamielinn Ln Unit 101
- 1830 Quintearo St
- 0 Moonlite Dr
- 1943 Quintearo St
- 4487 E Lake Mead Blvd Unit 32
- 4121 Courage Ct
- 4110 Courage Ct
- 4110 Crusader Ct
- 1847 Lincoln Rd
- 4120 Crusader Ct
- 1841 Lincoln Rd
- 4131 Courage Ct
- 4093 Amistad Ct
- 4130 Crusader Ct
- 4130 Courage Ct
- 4087 Amistad Ct
- 1823 Lincoln Rd
- 1846 Walnut Hollow St
- 1840 Walnut Hollow St
- 1834 Walnut Hollow St
- 1817 Lincoln Rd
- 4141 Courage Ct
- 4141 Courage Ct Unit n/a
- 4111 Bewitched Ct
- 4111 Crusader Ct