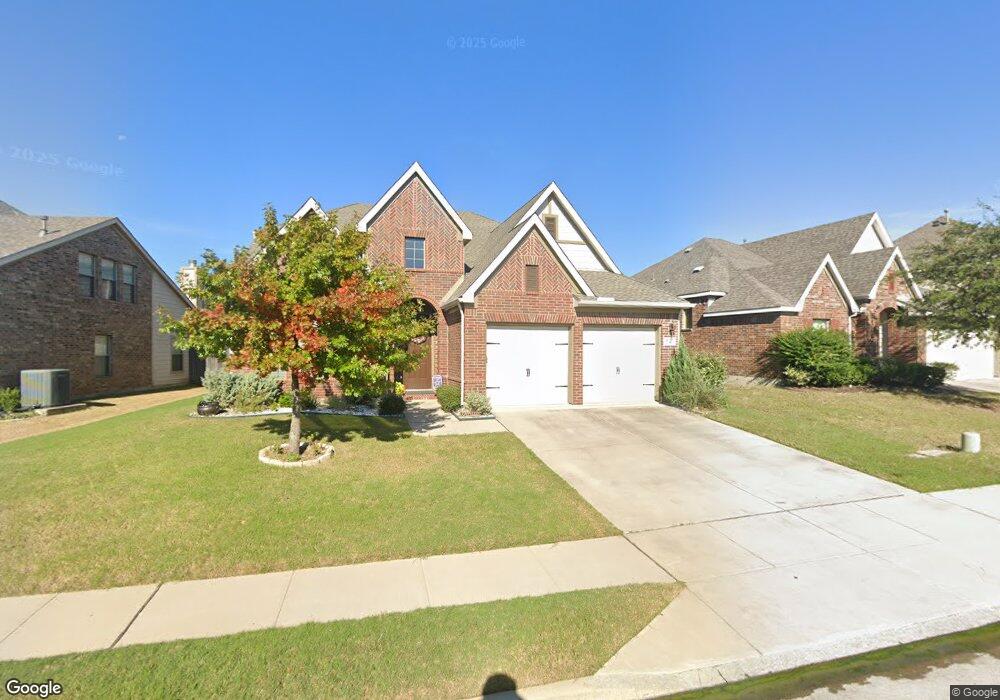
4111 Lee Hutson Dr Sachse, TX 75048
Estimated Value: $533,000 - $607,000
4
Beds
4
Baths
3,182
Sq Ft
$179/Sq Ft
Est. Value
About This Home
This home is located at 4111 Lee Hutson Dr, Sachse, TX 75048 and is currently estimated at $569,219, approximately $178 per square foot. 4111 Lee Hutson Dr is a home located in Dallas County with nearby schools including Pinnacle Montessori of Sachse, Firewheel Christian Academy, and Oakhill Day School.
Ownership History
Date
Name
Owned For
Owner Type
Purchase Details
Closed on
May 14, 2012
Sold by
Secretary Of Veterans Affairs
Bought by
Vandertutip Aevan Micah and Vandertutip Jennifer L
Current Estimated Value
Home Financials for this Owner
Home Financials are based on the most recent Mortgage that was taken out on this home.
Original Mortgage
$210,426
Outstanding Balance
$149,165
Interest Rate
4.4%
Mortgage Type
FHA
Estimated Equity
$420,054
Purchase Details
Closed on
Nov 2, 2011
Sold by
Terry Marcus H and Terry Astria Leigh
Bought by
Citimortgage Inc
Purchase Details
Closed on
Nov 1, 2011
Sold by
Citimortgage Inc
Bought by
Secretary Of Veterans Affairs
Purchase Details
Closed on
Aug 5, 2008
Sold by
Mhi Partnership Ltd
Bought by
Terry Marcus H and Terry Astria Leigh
Home Financials for this Owner
Home Financials are based on the most recent Mortgage that was taken out on this home.
Original Mortgage
$249,491
Interest Rate
6.54%
Mortgage Type
VA
Create a Home Valuation Report for This Property
The Home Valuation Report is an in-depth analysis detailing your home's value as well as a comparison with similar homes in the area
Home Values in the Area
Average Home Value in this Area
Purchase History
| Date | Buyer | Sale Price | Title Company |
|---|---|---|---|
| Vandertutip Aevan Micah | -- | Lawyers Title | |
| Citimortgage Inc | $197,412 | None Available | |
| Secretary Of Veterans Affairs | -- | None Available | |
| Terry Marcus H | -- | Stnt |
Source: Public Records
Mortgage History
| Date | Status | Borrower | Loan Amount |
|---|---|---|---|
| Open | Vandertutip Aevan Micah | $210,426 | |
| Previous Owner | Terry Marcus H | $249,491 |
Source: Public Records
Tax History Compared to Growth
Tax History
| Year | Tax Paid | Tax Assessment Tax Assessment Total Assessment is a certain percentage of the fair market value that is determined by local assessors to be the total taxable value of land and additions on the property. | Land | Improvement |
|---|---|---|---|---|
| 2025 | $9,831 | $582,020 | $85,000 | $497,020 |
| 2024 | $9,831 | $582,020 | $85,000 | $497,020 |
| 2023 | $9,831 | $500,090 | $70,000 | $430,090 |
| 2022 | $11,965 | $500,090 | $70,000 | $430,090 |
| 2021 | $9,888 | $384,240 | $65,000 | $319,240 |
| 2020 | $8,807 | $336,640 | $65,000 | $271,640 |
| 2019 | $9,549 | $336,640 | $65,000 | $271,640 |
| 2018 | $9,345 | $326,300 | $50,000 | $276,300 |
| 2017 | $8,989 | $312,980 | $50,000 | $262,980 |
| 2016 | $8,989 | $312,980 | $50,000 | $262,980 |
| 2015 | $5,329 | $276,340 | $50,000 | $226,340 |
| 2014 | $5,329 | $215,900 | $50,000 | $165,900 |
Source: Public Records
Map
Nearby Homes
- 4005 Hawthorne Dr
- 3417 Rosewood Ln
- 3476 Rosewood Ln
- 4406 Westcreek Ln
- 3302 Sewell Dr
- 3703 Stampede Dr
- 4818 Westcreek Ln
- 2402 Bent Oak Trail
- 2406 Bent Oak Trail
- 3611 Valley Forge
- 4924 Westcreek Ln
- 2422 Ash Ln
- 2418 Ash Ln
- 2414 Ash Ln
- 2402 Ash Ln
- 1641 Ben Davis Rd
- 3821 Red Oak St
- 4008 Leigh Ct
- 5014 Brookhollow Dr
- 3553 Leigh Ct
- 4107 Lee Hutson Dr
- 4115 Lee Hutson Dr
- 4119 Lee Hutson Dr
- 4103 Lee Hutson Dr
- 4112 Mane Dr
- 4108 Mane Dr
- 4116 Mane Dr
- 4104 Mane Dr
- 4123 Lee Hutson Dr
- 3919 Mustang Ave
- 4118 Lee Hutson Dr
- 4114 Lee Hutson Dr
- 4004 Mustang Ave
- 4110 Lee Hutson Dr
- 4122 Lee Hutson Dr
- 4127 Lee Hutson Dr
- 3915 Mustang Ave
- 4120 Mane Dr
- 4126 Lee Hutson Dr
- 4008 Mustang Ave