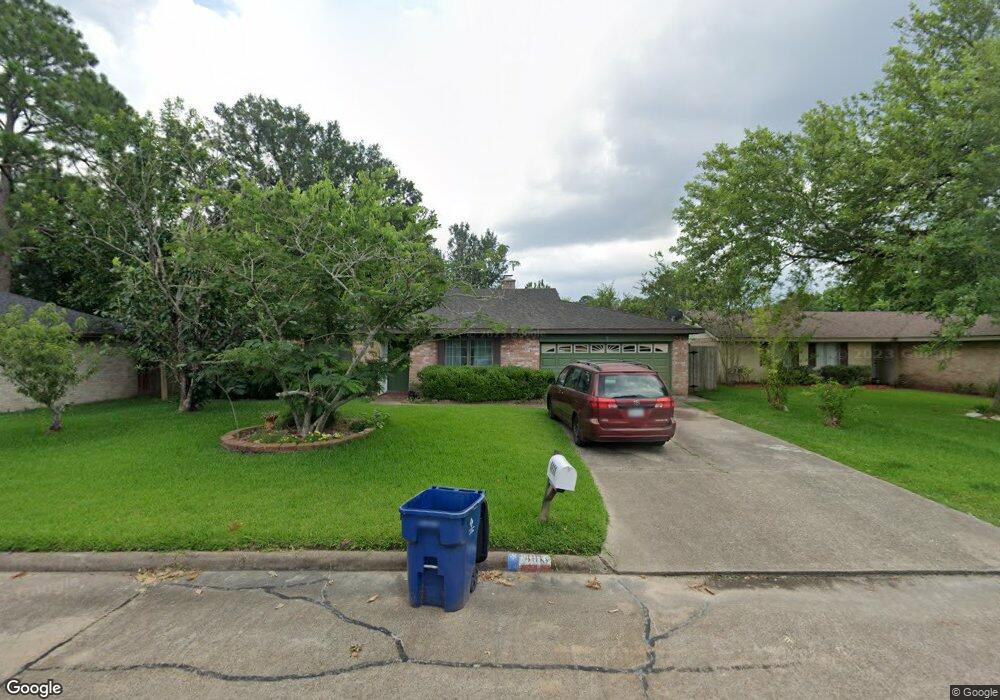
4111 Lucian Ln Friendswood, TX 77546
Estimated Value: $270,387 - $283,000
3
Beds
2
Baths
1,692
Sq Ft
$164/Sq Ft
Est. Value
About This Home
This home is located at 4111 Lucian Ln, Friendswood, TX 77546 and is currently estimated at $278,097, approximately $164 per square foot. 4111 Lucian Ln is a home located in Harris County with nearby schools including Wedgewood Elementary School, Brookside Intermediate School, and Clear Brook High School.
Ownership History
Date
Name
Owned For
Owner Type
Purchase Details
Closed on
Jul 28, 2005
Sold by
Bailey Edward B and Bailey Doris
Bought by
Younker Hallie Rose Evans
Current Estimated Value
Purchase Details
Closed on
Jun 17, 2004
Sold by
Carlin Clinton Clifford and Carlin Dorothy Jeanne
Bought by
Bailey Edward B
Home Financials for this Owner
Home Financials are based on the most recent Mortgage that was taken out on this home.
Original Mortgage
$95,000
Interest Rate
4.87%
Mortgage Type
Purchase Money Mortgage
Purchase Details
Closed on
Dec 31, 1996
Sold by
Frank Oliphint Inc
Bought by
Carlin Clinton C and Carlin Dorothy
Home Financials for this Owner
Home Financials are based on the most recent Mortgage that was taken out on this home.
Original Mortgage
$200,000
Interest Rate
7.53%
Mortgage Type
Seller Take Back
Create a Home Valuation Report for This Property
The Home Valuation Report is an in-depth analysis detailing your home's value as well as a comparison with similar homes in the area
Home Values in the Area
Average Home Value in this Area
Purchase History
| Date | Buyer | Sale Price | Title Company |
|---|---|---|---|
| Younker Hallie Rose Evans | -- | South Land Title Company | |
| Bailey Edward B | -- | Stewart Title Company | |
| Carlin Clinton C | -- | Chicago Title Insurance |
Source: Public Records
Mortgage History
| Date | Status | Borrower | Loan Amount |
|---|---|---|---|
| Previous Owner | Bailey Edward B | $95,000 | |
| Previous Owner | Carlin Clinton C | $200,000 | |
| Closed | Bailey Edward B | $17,985 |
Source: Public Records
Tax History Compared to Growth
Tax History
| Year | Tax Paid | Tax Assessment Tax Assessment Total Assessment is a certain percentage of the fair market value that is determined by local assessors to be the total taxable value of land and additions on the property. | Land | Improvement |
|---|---|---|---|---|
| 2025 | $403 | $339,247 | $59,480 | $279,767 |
| 2024 | $403 | $311,432 | $59,480 | $251,952 |
| 2023 | $403 | $314,101 | $59,480 | $254,621 |
| 2022 | $4,989 | $280,242 | $59,480 | $220,762 |
| 2021 | $4,781 | $237,073 | $48,585 | $188,488 |
| 2020 | $4,722 | $210,802 | $34,200 | $176,602 |
| 2019 | $4,502 | $193,011 | $26,202 | $166,809 |
| 2018 | $0 | $118,732 | $28,175 | $90,557 |
| 2017 | $3,929 | $152,218 | $28,175 | $124,043 |
| 2016 | $3,651 | $147,681 | $28,175 | $119,506 |
| 2015 | $1,319 | $135,088 | $28,175 | $106,913 |
| 2014 | $1,319 | $117,864 | $23,479 | $94,385 |
Source: Public Records
Map
Nearby Homes
- 16703 Hibiscus Ln
- 16607 David Glen Dr
- 16903 Paint Rock Rd
- 4015 Ravine Dr
- 16907 Tibet Rd
- 16423 Hibiscus Ln
- 17015 Townes Rd
- 4315 Ravine Dr
- 5498 Apple Blossom Ln
- 4430 Peridot Ln
- 16510 Blackhawk Blvd
- 4426 Saffron Ln
- 17003 Tibet Rd
- 16406 Blackhawk Blvd
- 16811 Bougainvilla Ln
- 16303 Townes Rd
- 5323 Abercreek Ave
- 16823 Bougainvilla Ln
- 16327 Blackhawk Blvd
- 3836 Laura Leigh Dr
- 16702 Hibiscus Ln
- 16706 Hibiscus Ln
- 4207 Lucian Ln
- 16710 Hibiscus Ln
- 4110 Lucian Ln
- 16703 Paint Rock Rd
- 4206 Saffron Ln
- 4206 Lucian Ln
- 4106 Lucian Ln
- 4210 Lucian Ln
- 4102 Lucian Ln
- 16718 Hibiscus Ln
- 4215 Lucian Ln
- 4210 Saffron Ln
- 16707 Hibiscus Ln
- 4214 Lucian Ln
- 16707 Paint Rock Rd
- 16711 Hibiscus Ln
- 4014 Lucian Ln
- 16722 Hibiscus Ln