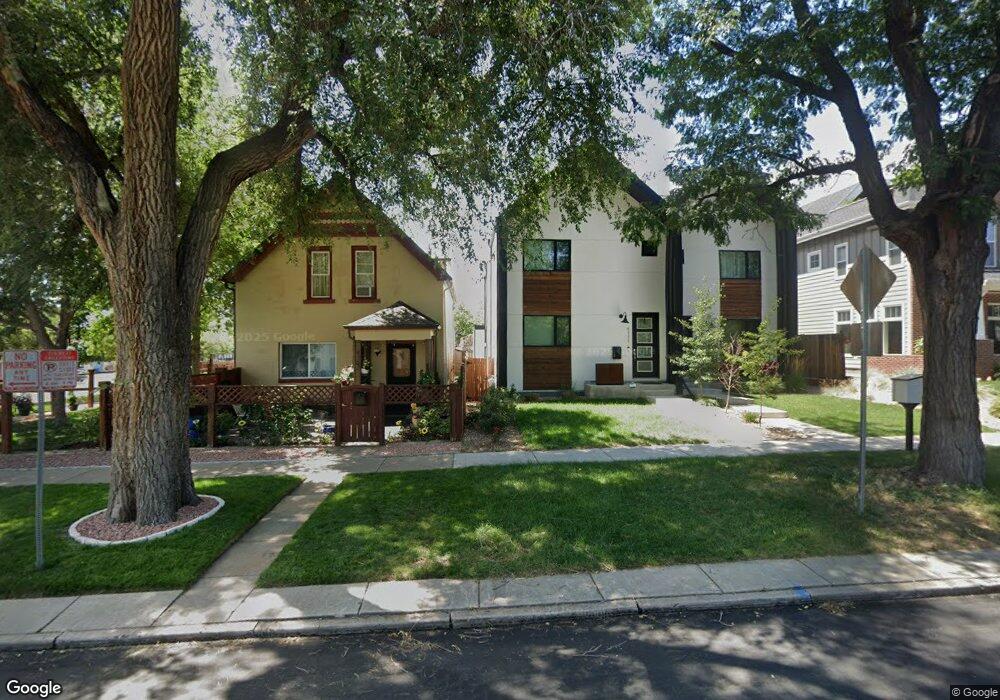
4111 Osage St Denver, CO 80211
Sunnyside NeighborhoodEstimated Value: $890,834 - $1,030,000
3
Beds
3
Baths
1,800
Sq Ft
$535/Sq Ft
Est. Value
About This Home
This home is located at 4111 Osage St, Denver, CO 80211 and is currently estimated at $962,459, approximately $534 per square foot. 4111 Osage St is a home located in Denver County with nearby schools including Bryant Webster Dual Language School, Denver Montessori Junior/Senior High School, and Skinner Middle School.
Ownership History
Date
Name
Owned For
Owner Type
Purchase Details
Closed on
Mar 18, 2020
Sold by
Mccarroll Robert and Mccarroll Marybeth
Bought by
Scott Deven A and Bordewyk Alex W
Current Estimated Value
Home Financials for this Owner
Home Financials are based on the most recent Mortgage that was taken out on this home.
Original Mortgage
$500,000
Outstanding Balance
$441,977
Interest Rate
3.4%
Mortgage Type
New Conventional
Estimated Equity
$520,482
Purchase Details
Closed on
Oct 3, 2018
Sold by
662 Meade Llc
Bought by
Mccarroll Robert and Mccarroll Maybeth
Home Financials for this Owner
Home Financials are based on the most recent Mortgage that was taken out on this home.
Original Mortgage
$508,500
Interest Rate
4.5%
Mortgage Type
New Conventional
Create a Home Valuation Report for This Property
The Home Valuation Report is an in-depth analysis detailing your home's value as well as a comparison with similar homes in the area
Home Values in the Area
Average Home Value in this Area
Purchase History
| Date | Buyer | Sale Price | Title Company |
|---|---|---|---|
| Scott Deven A | $735,000 | First American Title | |
| Mccarroll Robert | $708,500 | Heritage Title Co |
Source: Public Records
Mortgage History
| Date | Status | Borrower | Loan Amount |
|---|---|---|---|
| Open | Scott Deven A | $500,000 | |
| Previous Owner | Mccarroll Robert | $508,500 |
Source: Public Records
Tax History Compared to Growth
Tax History
| Year | Tax Paid | Tax Assessment Tax Assessment Total Assessment is a certain percentage of the fair market value that is determined by local assessors to be the total taxable value of land and additions on the property. | Land | Improvement |
|---|---|---|---|---|
| 2024 | $4,663 | $58,880 | $15,800 | $43,080 |
| 2023 | $4,562 | $58,880 | $15,800 | $43,080 |
| 2022 | $4,044 | $50,850 | $17,180 | $33,670 |
| 2021 | $4,044 | $52,300 | $17,670 | $34,630 |
| 2020 | $3,533 | $47,620 | $14,560 | $33,060 |
| 2019 | $3,434 | $47,620 | $14,560 | $33,060 |
| 2018 | $1,689 | $21,830 | $10,520 | $11,310 |
Source: Public Records
Map
Nearby Homes