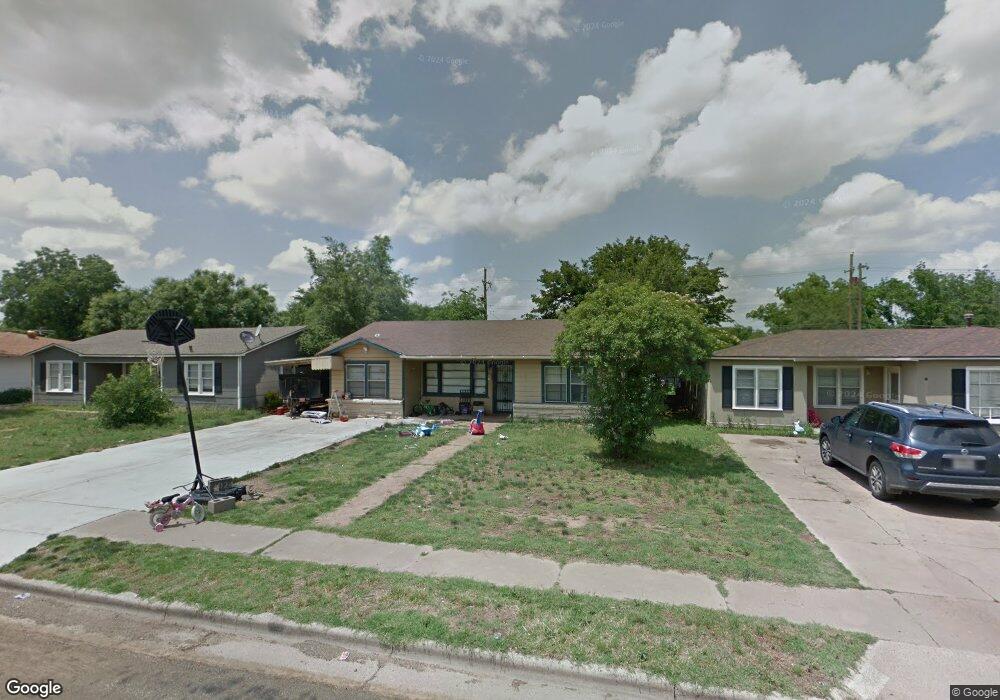
4112 32nd St Lubbock, TX 79410
Maxey Park NeighborhoodEstimated Value: $133,000 - $146,544
3
Beds
1
Bath
1,150
Sq Ft
$124/Sq Ft
Est. Value
About This Home
This home is located at 4112 32nd St, Lubbock, TX 79410 and is currently estimated at $142,136, approximately $123 per square foot. 4112 32nd St is a home located in Lubbock County with nearby schools including Overton Elementary School, Commander William C. McCool Academy, and Mackenzie Middle School.
Ownership History
Date
Name
Owned For
Owner Type
Purchase Details
Closed on
Jun 15, 2021
Sold by
Frazier Kim Lee
Bought by
Rieff Justin Revel
Current Estimated Value
Home Financials for this Owner
Home Financials are based on the most recent Mortgage that was taken out on this home.
Original Mortgage
$123,190
Outstanding Balance
$111,533
Interest Rate
2.9%
Mortgage Type
New Conventional
Estimated Equity
$30,603
Purchase Details
Closed on
Apr 6, 2020
Sold by
Hildahl Kimberly Denise and Halliman Brandi Michelle
Bought by
Frazier Kim Lee
Home Financials for this Owner
Home Financials are based on the most recent Mortgage that was taken out on this home.
Original Mortgage
$75,000
Interest Rate
3.4%
Mortgage Type
Commercial
Purchase Details
Closed on
Sep 23, 1992
Sold by
Hallinan David L
Bought by
Hallinan Davis Lance
Purchase Details
Closed on
Jul 28, 1988
Bought by
Hallinan Davis Lance
Create a Home Valuation Report for This Property
The Home Valuation Report is an in-depth analysis detailing your home's value as well as a comparison with similar homes in the area
Home Values in the Area
Average Home Value in this Area
Purchase History
| Date | Buyer | Sale Price | Title Company |
|---|---|---|---|
| Rieff Justin Revel | -- | Titleone | |
| Frazier Kim Lee | -- | Title One | |
| Hallinan Davis Lance | -- | -- | |
| Hallinan Davis Lance | -- | -- |
Source: Public Records
Mortgage History
| Date | Status | Borrower | Loan Amount |
|---|---|---|---|
| Open | Rieff Justin Revel | $123,190 | |
| Previous Owner | Frazier Kim Lee | $75,000 |
Source: Public Records
Tax History Compared to Growth
Tax History
| Year | Tax Paid | Tax Assessment Tax Assessment Total Assessment is a certain percentage of the fair market value that is determined by local assessors to be the total taxable value of land and additions on the property. | Land | Improvement |
|---|---|---|---|---|
| 2025 | $2,757 | $138,116 | $23,500 | $114,616 |
| 2024 | $2,757 | $151,802 | $23,500 | $128,302 |
| 2023 | $2,455 | $132,094 | $10,065 | $122,029 |
| 2022 | $2,593 | $128,103 | $10,065 | $118,038 |
| 2021 | $1,892 | $88,342 | $10,065 | $78,277 |
| 2020 | $1,898 | $87,306 | $10,065 | $77,241 |
| 2019 | $1,972 | $87,824 | $10,065 | $77,759 |
| 2018 | $1,904 | $84,713 | $10,065 | $74,648 |
| 2017 | $1,685 | $74,864 | $10,065 | $64,799 |
| 2016 | $1,558 | $69,224 | $10,065 | $59,159 |
| 2015 | $1,184 | $62,931 | $10,065 | $52,866 |
| 2014 | $1,184 | $61,592 | $4,950 | $56,642 |
Source: Public Records
Map
Nearby Homes