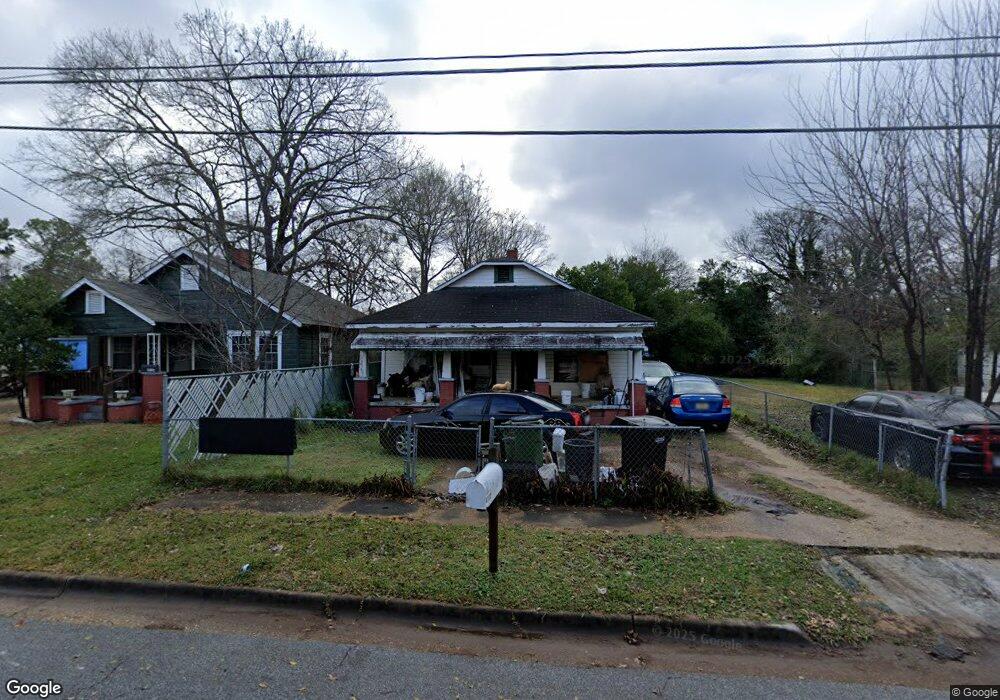
4112 7th Ave Columbus, GA 31904
North Highlands NeighborhoodEstimated Value: $45,000 - $80,000
2
Beds
2
Baths
952
Sq Ft
$67/Sq Ft
Est. Value
About This Home
This home is located at 4112 7th Ave, Columbus, GA 31904 and is currently estimated at $63,961, approximately $67 per square foot. 4112 7th Ave is a home located in Muscogee County with nearby schools including Fox Elementary School, Arnold Middle School, and Jordan Vocational High School.
Ownership History
Date
Name
Owned For
Owner Type
Purchase Details
Closed on
Jul 12, 2010
Sold by
Rp Investment Group Llc
Bought by
Ric Mark Properties Llc
Current Estimated Value
Home Financials for this Owner
Home Financials are based on the most recent Mortgage that was taken out on this home.
Original Mortgage
$24,500
Interest Rate
4.77%
Mortgage Type
New Conventional
Purchase Details
Closed on
Jul 1, 2010
Sold by
Sanders Barbie and Jones Pamela G
Bought by
Rp Investment Group Llc
Home Financials for this Owner
Home Financials are based on the most recent Mortgage that was taken out on this home.
Original Mortgage
$24,500
Interest Rate
4.77%
Mortgage Type
New Conventional
Purchase Details
Closed on
Aug 28, 2009
Sold by
Sanders Barbie
Bought by
Jones Pamela G and Sanders Barbie
Create a Home Valuation Report for This Property
The Home Valuation Report is an in-depth analysis detailing your home's value as well as a comparison with similar homes in the area
Home Values in the Area
Average Home Value in this Area
Purchase History
| Date | Buyer | Sale Price | Title Company |
|---|---|---|---|
| Ric Mark Properties Llc | $27,000 | None Available | |
| Rp Investment Group Llc | $15,000 | None Available | |
| Jones Pamela G | -- | None Available | |
| Sanders Barbie | $39,500 | None Available |
Source: Public Records
Mortgage History
| Date | Status | Borrower | Loan Amount |
|---|---|---|---|
| Closed | Ric Mark Properties Llc | $24,500 |
Source: Public Records
Tax History
| Year | Tax Paid | Tax Assessment Tax Assessment Total Assessment is a certain percentage of the fair market value that is determined by local assessors to be the total taxable value of land and additions on the property. | Land | Improvement |
|---|---|---|---|---|
| 2025 | $419 | $21,612 | $4,820 | $16,792 |
| 2024 | $419 | $10,710 | $3,372 | $7,338 |
| 2023 | $422 | $10,710 | $3,372 | $7,338 |
| 2022 | $331 | $12,620 | $3,372 | $9,248 |
| 2021 | $331 | $8,096 | $3,372 | $4,724 |
| 2020 | $454 | $11,104 | $3,372 | $7,732 |
| 2019 | $410 | $10,000 | $2,500 | $7,500 |
| 2018 | $410 | $10,000 | $2,500 | $7,500 |
| 2017 | $411 | $10,000 | $2,500 | $7,500 |
| 2016 | $648 | $15,701 | $1,480 | $14,221 |
| 2015 | $648 | $15,701 | $1,480 | $14,221 |
| 2014 | $649 | $15,701 | $1,480 | $14,221 |
| 2013 | -- | $15,701 | $1,480 | $14,221 |
Source: Public Records
Map
Nearby Homes
Your Personal Tour Guide
Ask me questions while you tour the home.