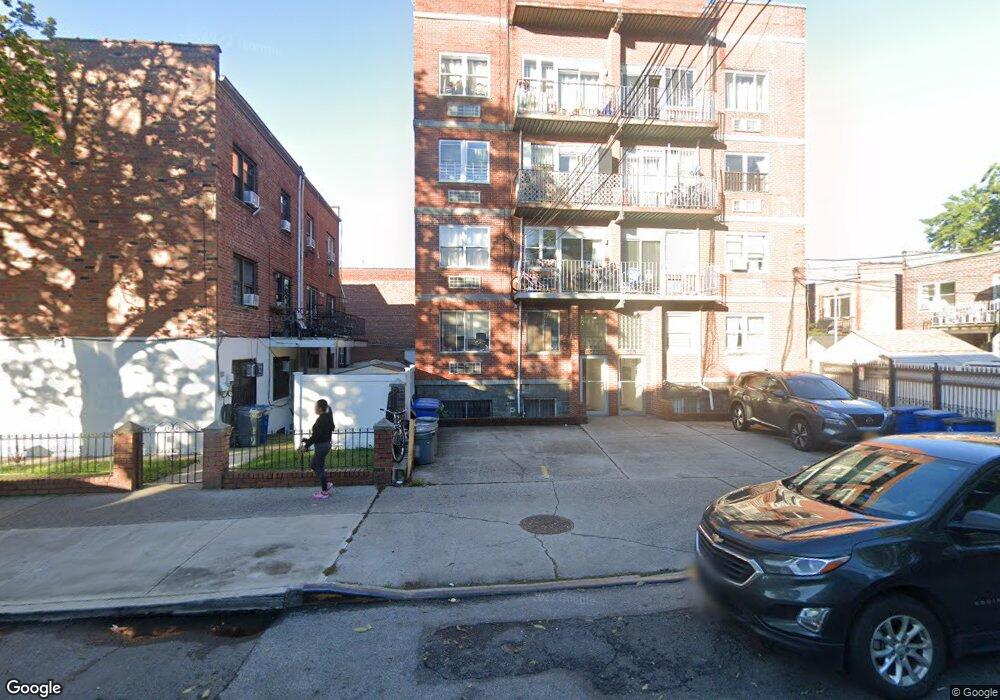
4112 97th Place Unit 2A Corona, NY 11368
Corona NeighborhoodEstimated Value: $248,000 - $569,000
--
Bed
--
Bath
1,040
Sq Ft
$409/Sq Ft
Est. Value
About This Home
This home is located at 4112 97th Place Unit 2A, Corona, NY 11368 and is currently estimated at $425,464, approximately $409 per square foot. 4112 97th Place Unit 2A is a home located in Queens County with nearby schools including P.S. 19 Marino Jeantet, Is 61 Leonardo Da Vinci, and John Bowne High School.
Ownership History
Date
Name
Owned For
Owner Type
Purchase Details
Closed on
Jul 30, 2004
Sold by
Chen Li Qun and Pan Min Hui
Bought by
Zhang Dong C
Current Estimated Value
Home Financials for this Owner
Home Financials are based on the most recent Mortgage that was taken out on this home.
Original Mortgage
$259,200
Interest Rate
6.16%
Mortgage Type
Purchase Money Mortgage
Purchase Details
Closed on
Feb 10, 1999
Sold by
Lai Sammy Ming and Lai Ming
Bought by
Pan Min Hui and Chen Li Qun
Home Financials for this Owner
Home Financials are based on the most recent Mortgage that was taken out on this home.
Original Mortgage
$77,250
Interest Rate
6.83%
Purchase Details
Closed on
Jul 29, 1995
Sold by
Lai Bark How and Lai Ming
Bought by
Lai Sammy Ming and Lai Ming
Create a Home Valuation Report for This Property
The Home Valuation Report is an in-depth analysis detailing your home's value as well as a comparison with similar homes in the area
Home Values in the Area
Average Home Value in this Area
Purchase History
| Date | Buyer | Sale Price | Title Company |
|---|---|---|---|
| Zhang Dong C | $288,000 | -- | |
| Zhang Dong C | $288,000 | -- | |
| Pan Min Hui | $103,000 | Chicago Title Insurance Co | |
| Pan Min Hui | $103,000 | Chicago Title Insurance Co | |
| Lai Sammy Ming | -- | -- | |
| Lai Sammy Ming | -- | -- |
Source: Public Records
Mortgage History
| Date | Status | Borrower | Loan Amount |
|---|---|---|---|
| Previous Owner | Zhang Dong C | $259,200 | |
| Previous Owner | Pan Min Hui | $77,250 |
Source: Public Records
Tax History Compared to Growth
Tax History
| Year | Tax Paid | Tax Assessment Tax Assessment Total Assessment is a certain percentage of the fair market value that is determined by local assessors to be the total taxable value of land and additions on the property. | Land | Improvement |
|---|---|---|---|---|
| 2025 | $5,909 | $47,532 | $4,437 | $43,095 |
| 2024 | $4,248 | $47,261 | $4,437 | $42,824 |
| 2023 | $5,627 | $45,012 | $4,437 | $40,575 |
| 2022 | $3,597 | $48,285 | $4,437 | $43,848 |
| 2021 | $3,385 | $40,754 | $4,437 | $36,317 |
| 2020 | $3,328 | $44,468 | $4,437 | $40,031 |
| 2019 | $3,122 | $42,507 | $4,437 | $38,070 |
| 2018 | $4,081 | $34,413 | $4,436 | $29,977 |
| 2017 | $3,814 | $31,705 | $4,437 | $27,268 |
| 2016 | $3,610 | $31,705 | $4,437 | $27,268 |
| 2015 | $2,234 | $29,108 | $4,437 | $24,671 |
| 2014 | $2,234 | $27,828 | $4,437 | $23,391 |
Source: Public Records
Map
Nearby Homes
- 9628 41st Ave
- 97-28 41st Ave
- 40-48 97th St Unit 1B
- 4048 97th St Unit 3E
- 40-48 97th St Unit 3D
- 40-48 97th St Unit 2
- 97-10 43rd Ave
- 4035 97th St
- 40-42 Junction Blvd
- 40-45 99th St
- 95-20 41st Ave
- 95-13 42nd Ave
- 9905 43rd Ave Unit 2A
- 4131 95th St
- 4036 100th St
- 94-67 44th Ave
- 9465 44th Ave
- 40-4 97th St
- 9461 43rd Ave
- 100-04 Spruce St
- 4110 97th Place Unit 4D
- 4108 97th Place Unit 4C
- 4110 97th Place Unit 4B
- 4110 97th Place Unit 4A
- 4108 97th Place Unit 3D
- 4108 97th Place Unit 3C
- 4110 97th Place Unit 3B
- 4110 97th Place Unit 3A
- 4110 97th Place Unit 2B
- 4110 97th Place Unit 1B
- 4110 97th Place Unit 1A
- 4108 97th Place Unit 4D
- 4110 97th Place
- 4112 97th Place Unit 3B
- 4108 97th Place Unit 4C
- 41-08 97th Place Unit 4D
- 41-08 97th Place
- 4108 97th Place Unit 4D
- 4108 97th Place Unit 3C
- 4110 97th Place Unit 4D