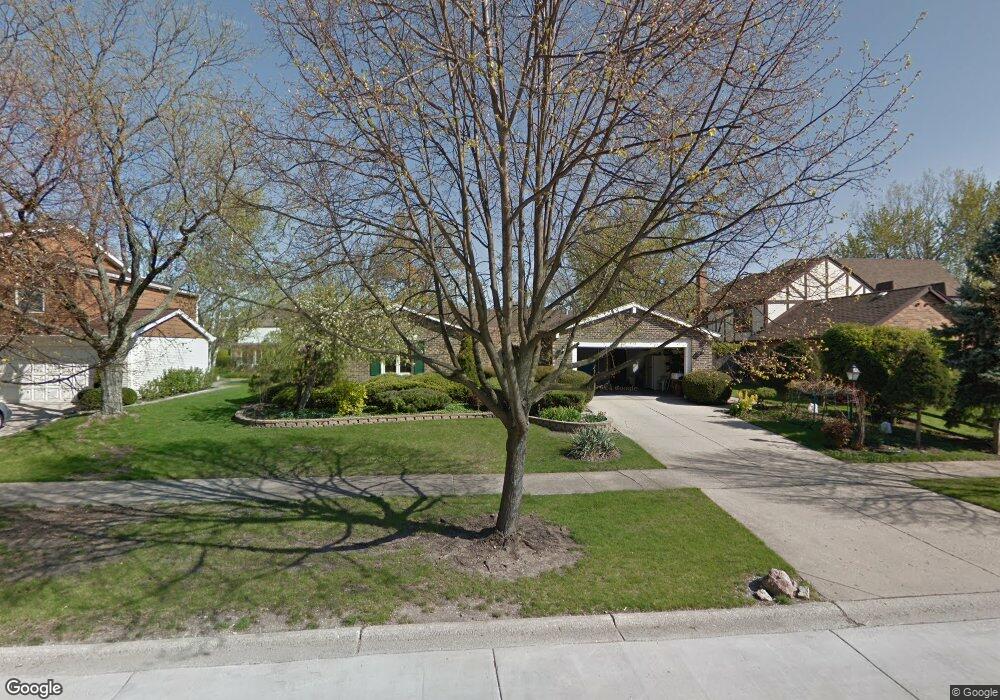
4112 Chester Dr Glenview, IL 60026
The Willows NeighborhoodEstimated Value: $764,000 - $856,000
4
Beds
3
Baths
2,498
Sq Ft
$325/Sq Ft
Est. Value
About This Home
This home is located at 4112 Chester Dr, Glenview, IL 60026 and is currently estimated at $811,043, approximately $324 per square foot. 4112 Chester Dr is a home located in Cook County with nearby schools including Henry Winkelman Elementary School, Field Middle School, and Glenbrook South High School.
Ownership History
Date
Name
Owned For
Owner Type
Purchase Details
Closed on
Oct 25, 2017
Sold by
Cohen Edward S
Bought by
Declaratio Cohen Edward S and Edward S Cohen Self Declaration Of Trust
Current Estimated Value
Purchase Details
Closed on
Apr 3, 2017
Sold by
Kim Mark S and Kim Moonsoon
Bought by
Cohen Edward
Home Financials for this Owner
Home Financials are based on the most recent Mortgage that was taken out on this home.
Original Mortgage
$205,000
Outstanding Balance
$170,075
Interest Rate
4.1%
Mortgage Type
New Conventional
Estimated Equity
$640,968
Purchase Details
Closed on
Feb 11, 2012
Sold by
Kim Boksool and Kim Mark S
Bought by
Kim Mark S and Kim Moonsoon
Purchase Details
Closed on
Jun 24, 2004
Sold by
Bank One Trust Co Na
Bought by
Kim Boksool and Kim Mark S
Create a Home Valuation Report for This Property
The Home Valuation Report is an in-depth analysis detailing your home's value as well as a comparison with similar homes in the area
Home Values in the Area
Average Home Value in this Area
Purchase History
| Date | Buyer | Sale Price | Title Company |
|---|---|---|---|
| Declaratio Cohen Edward S | -- | Attorney | |
| Cohen Edward | -- | None Available | |
| Kim Mark S | -- | None Available | |
| Kim Boksool | -- | -- |
Source: Public Records
Mortgage History
| Date | Status | Borrower | Loan Amount |
|---|---|---|---|
| Open | Cohen Edward | $205,000 |
Source: Public Records
Tax History Compared to Growth
Tax History
| Year | Tax Paid | Tax Assessment Tax Assessment Total Assessment is a certain percentage of the fair market value that is determined by local assessors to be the total taxable value of land and additions on the property. | Land | Improvement |
|---|---|---|---|---|
| 2024 | $9,648 | $51,000 | $14,230 | $36,770 |
| 2023 | $9,546 | $51,000 | $14,230 | $36,770 |
| 2022 | $9,546 | $51,000 | $14,230 | $36,770 |
| 2021 | $10,788 | $49,656 | $11,942 | $37,714 |
| 2020 | $11,696 | $49,656 | $11,942 | $37,714 |
| 2019 | $11,356 | $54,567 | $11,942 | $42,625 |
| 2018 | $11,466 | $50,272 | $10,418 | $39,854 |
| 2017 | $12,044 | $54,196 | $10,418 | $43,778 |
| 2016 | $11,418 | $54,196 | $10,418 | $43,778 |
| 2015 | $10,504 | $45,098 | $8,385 | $36,713 |
| 2014 | $10,207 | $45,098 | $8,385 | $36,713 |
| 2013 | $9,993 | $45,098 | $8,385 | $36,713 |
Source: Public Records
Map
Nearby Homes
- 4036 Miller Dr
- 3026 Glenway Dr
- 2809 Meadowview Ct
- 3931 Miller Dr
- 4250 Meadowview Dr
- 2803 Wildflower Ct
- 2960 Willow Rd
- 3005 Highland Rd
- 3263 Doriann Dr
- 2503 Indian Ridge Dr
- 2509 Astor Ct
- 3800 Kiess Dr
- 3820 Kiess Dr
- 3190 Landwehr Rd
- 2290 Cedar Ct
- 3246 Landwehr Rd Unit 3
- 3550 Ari Dr E
- 2308 Indian Ridge Dr
- 2250 White Oak Dr
- 3537 Maple Leaf Dr
- 4106 Chester Dr
- 4118 Chester Dr
- 4115 Miller Dr
- 4121 Miller Dr
- 4100 Chester Dr
- 4109 Miller Dr
- 4113 Chester Dr
- 4107 Chester Dr
- 4103 Miller Dr
- 4119 Chester Dr
- 4044 Chester Dr
- 4146 Miller Dr
- 4142 Miller Dr
- 4125 Chester Dr
- 4043 Miller Dr
- 4138 Miller Dr
- 4045 Chester Dr
- 4038 Chester Dr
- 4131 Chester Dr
- 4114 Miller Dr