Estimated Value: $423,000 - $606,000
3
Beds
1
Bath
2,400
Sq Ft
$199/Sq Ft
Est. Value
About This Home
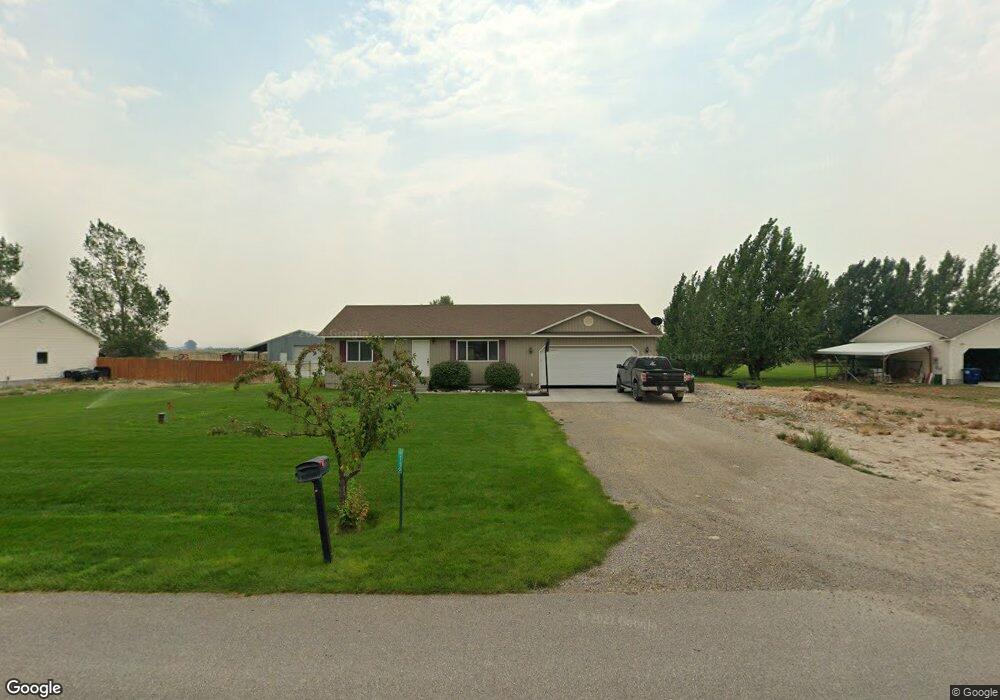
This home is located at 4112 E 82 N, Rigby, ID 83442 and is currently estimated at $477,468, approximately $198 per square foot. 4112 E 82 N is a home located in Jefferson County with nearby schools including South Fork Elementary School, Rigby Middle School, and Rigby High School.
Ownership History
Date
Name
Owned For
Owner Type
Purchase Details
Closed on
Jun 15, 2009
Sold by
Morse Keith and Morse April
Bought by
Stucki Mark and Stucki Andrea
Current Estimated Value
Home Financials for this Owner
Home Financials are based on the most recent Mortgage that was taken out on this home.
Original Mortgage
$154,000
Outstanding Balance
$105,480
Interest Rate
4.76%
Mortgage Type
USDA
Estimated Equity
$371,988
Purchase Details
Closed on
Feb 27, 2006
Sold by
Settlement Builders Llc
Bought by
Morse Keith and Morse April
Home Financials for this Owner
Home Financials are based on the most recent Mortgage that was taken out on this home.
Original Mortgage
$142,656
Interest Rate
6.15%
Mortgage Type
FHA
Create a Home Valuation Report for This Property
The Home Valuation Report is an in-depth analysis detailing your home's value as well as a comparison with similar homes in the area
Purchase History
| Date | Buyer | Sale Price | Title Company |
|---|---|---|---|
| Stucki Mark | -- | -- | |
| Morse Keith | -- | -- |
Source: Public Records
Mortgage History
| Date | Status | Borrower | Loan Amount |
|---|---|---|---|
| Open | Stucki Mark | $154,000 | |
| Previous Owner | Morse Keith | $142,656 |
Source: Public Records
Tax History
| Year | Tax Paid | Tax Assessment Tax Assessment Total Assessment is a certain percentage of the fair market value that is determined by local assessors to be the total taxable value of land and additions on the property. | Land | Improvement |
|---|---|---|---|---|
| 2025 | $811 | $408,548 | $0 | $0 |
| 2024 | $811 | $406,814 | $0 | $0 |
| 2023 | $1,250 | $418,701 | $0 | $0 |
| 2022 | $1,690 | $359,469 | $0 | $0 |
| 2021 | $1,366 | $265,500 | $0 | $0 |
| 2020 | $1,150 | $242,052 | $0 | $0 |
| 2019 | $1,214 | $214,408 | $0 | $0 |
| 2018 | $1,071 | $188,536 | $0 | $0 |
| 2017 | $1,008 | $170,096 | $0 | $0 |
| 2016 | $906 | $74,322 | $0 | $0 |
| 2015 | $878 | $69,185 | $0 | $0 |
| 2014 | $881 | $69,185 | $0 | $0 |
| 2013 | -- | $69,185 | $0 | $0 |
Source: Public Records
Map
Nearby Homes
Your Personal Tour Guide
Ask me questions while you tour the home.