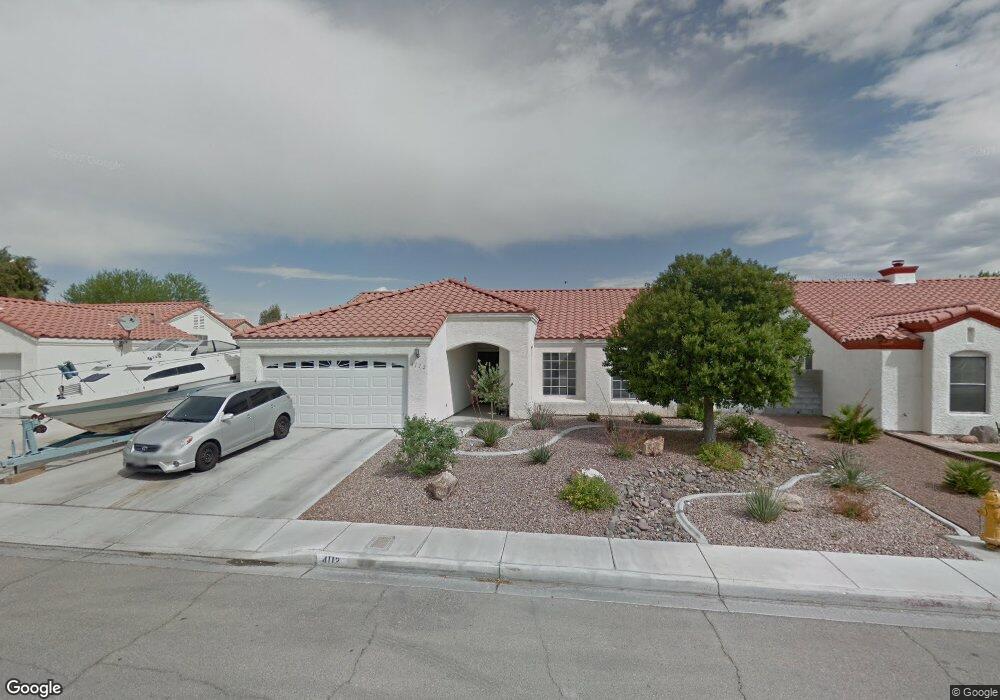
4112 Extenso Dr North Las Vegas, NV 89032
Cheyenne NeighborhoodEstimated Value: $391,654 - $435,000
3
Beds
2
Baths
1,470
Sq Ft
$282/Sq Ft
Est. Value
About This Home
This home is located at 4112 Extenso Dr, North Las Vegas, NV 89032 and is currently estimated at $413,914, approximately $281 per square foot. 4112 Extenso Dr is a home located in Clark County with nearby schools including Lucile Bruner Elementary School, Theron L Swainston Middle School, and Cheyenne High School.
Ownership History
Date
Name
Owned For
Owner Type
Purchase Details
Closed on
Aug 16, 2017
Sold by
Sherretts Patti A
Bought by
Something Trust
Current Estimated Value
Purchase Details
Closed on
Jan 29, 2002
Sold by
Minich Michael E
Bought by
Sherrets Patti A and Minich Patti A
Home Financials for this Owner
Home Financials are based on the most recent Mortgage that was taken out on this home.
Original Mortgage
$114,500
Interest Rate
6.94%
Purchase Details
Closed on
Apr 16, 1997
Sold by
Minich Michael E and Minich Patti A
Bought by
Minich Michael E and Minich Patti A
Home Financials for this Owner
Home Financials are based on the most recent Mortgage that was taken out on this home.
Original Mortgage
$25,000
Interest Rate
7.86%
Purchase Details
Closed on
Aug 8, 1995
Sold by
Watson Douglas Eric and Watson Cathy J
Bought by
Minich Michael E and Sherretts Patti A
Home Financials for this Owner
Home Financials are based on the most recent Mortgage that was taken out on this home.
Original Mortgage
$122,904
Interest Rate
7.97%
Mortgage Type
FHA
Create a Home Valuation Report for This Property
The Home Valuation Report is an in-depth analysis detailing your home's value as well as a comparison with similar homes in the area
Home Values in the Area
Average Home Value in this Area
Purchase History
| Date | Buyer | Sale Price | Title Company |
|---|---|---|---|
| Something Trust | -- | None Available | |
| Sherrets Patti A | -- | First American Title Co | |
| Minich Michael E | -- | -- | |
| Minich Michael E | $124,500 | Land Title |
Source: Public Records
Mortgage History
| Date | Status | Borrower | Loan Amount |
|---|---|---|---|
| Previous Owner | Sherrets Patti A | $114,500 | |
| Previous Owner | Minich Michael E | $25,000 | |
| Previous Owner | Minich Michael E | $122,904 |
Source: Public Records
Tax History Compared to Growth
Tax History
| Year | Tax Paid | Tax Assessment Tax Assessment Total Assessment is a certain percentage of the fair market value that is determined by local assessors to be the total taxable value of land and additions on the property. | Land | Improvement |
|---|---|---|---|---|
| 2025 | $1,650 | $79,798 | $28,000 | $51,798 |
| 2024 | $1,528 | $79,798 | $28,000 | $51,798 |
| 2023 | $1,528 | $79,211 | $29,750 | $49,461 |
| 2022 | $1,415 | $70,583 | $25,200 | $45,383 |
| 2021 | $1,371 | $65,444 | $22,050 | $43,394 |
| 2020 | $1,270 | $64,468 | $21,350 | $43,118 |
| 2019 | $1,190 | $59,568 | $16,800 | $42,768 |
| 2018 | $1,135 | $54,971 | $13,650 | $41,321 |
| 2017 | $1,832 | $54,623 | $12,600 | $42,023 |
| 2016 | $1,064 | $48,736 | $9,800 | $38,936 |
| 2015 | $1,061 | $38,018 | $7,000 | $31,018 |
| 2014 | $1,030 | $36,635 | $5,250 | $31,385 |
Source: Public Records
Map
Nearby Homes
- 4013 Extenso Dr
- 4002 Extenso Dr
- 4230 Valley Spruce Way
- 4115 Tatum Ct
- 4108 Dove Creek Rd
- 3938 Redfield Ave
- 4537 Colonial Canyon St
- 4335 Twin Peaks Dr
- 4341 San Mateo St
- 4207 Oak Bay Way
- 4508 W San Miguel Ave
- 4508 San Mateo St
- 3804 Dauntless Dr
- 4528 Strato Jet Way
- 4448 Whelk Place
- 4001 Clove Tree Ct
- 4633 Lost Creek Ct
- 4006 Clove Tree Ct
- 3519 W Red Coach Ave
- 4640 Stearman Dr
- 4116 Extenso Dr
- 4108 Extenso Dr
- 4111 Evora Cir
- 4107 Evora Cir
- 4115 Evora Cir
- 4120 Extenso Dr
- 4104 Extenso Dr
- 4219 Fino Cir
- 4103 Evora Cir
- 4220 Fino Cir
- 4119 Evora Cir
- 4124 Extenso Dr
- 4215 Fino Cir
- 4216 Fino Cir
- 4123 Evora Cir
- 4220 Famoso Dr
- 4108 Evora Cir
- 4112 Evora Cir
- 4018 Extenso Dr
- 4104 Evora Cir