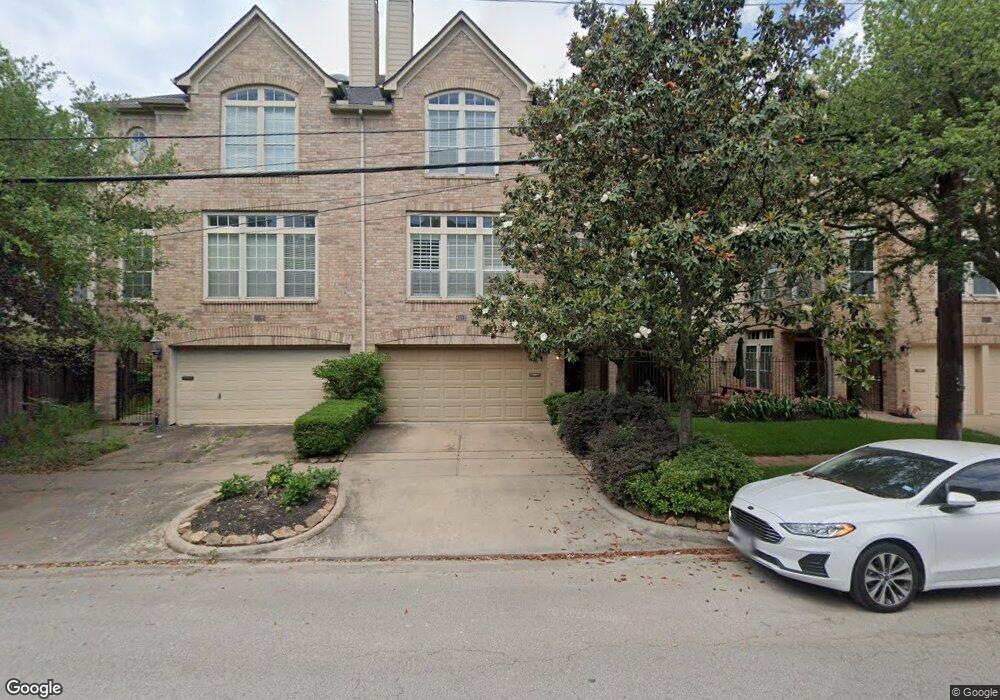
4112 Woodhead St Houston, TX 77098
Montrose NeighborhoodEstimated Value: $557,922 - $636,000
3
Beds
4
Baths
2,519
Sq Ft
$235/Sq Ft
Est. Value
About This Home
This home is located at 4112 Woodhead St, Houston, TX 77098 and is currently estimated at $591,731, approximately $234 per square foot. 4112 Woodhead St is a home located in Harris County with nearby schools including Poe Elementary School, Lanier Middle School, and Lamar High School.
Ownership History
Date
Name
Owned For
Owner Type
Purchase Details
Closed on
Sep 12, 2023
Sold by
Provenzano Margaret Ann
Bought by
Turc20 Llc
Current Estimated Value
Purchase Details
Closed on
Sep 23, 2022
Sold by
David Key and David Larry
Bought by
Colquitt Properties Llc
Purchase Details
Closed on
Nov 26, 2007
Sold by
Mayfield Eric P and Mayfield Debra E
Bought by
Taub Casey C
Home Financials for this Owner
Home Financials are based on the most recent Mortgage that was taken out on this home.
Original Mortgage
$236,000
Interest Rate
6.43%
Mortgage Type
Purchase Money Mortgage
Purchase Details
Closed on
Mar 28, 2003
Sold by
Smith Joyce Parr and Smith Marshall A
Bought by
Mayfield Eric P and Ibarra Debra E
Home Financials for this Owner
Home Financials are based on the most recent Mortgage that was taken out on this home.
Original Mortgage
$219,200
Interest Rate
4.62%
Purchase Details
Closed on
Nov 30, 1999
Sold by
Perry Homes
Bought by
Smith Joyce Parr
Create a Home Valuation Report for This Property
The Home Valuation Report is an in-depth analysis detailing your home's value as well as a comparison with similar homes in the area
Home Values in the Area
Average Home Value in this Area
Purchase History
| Date | Buyer | Sale Price | Title Company |
|---|---|---|---|
| Turc20 Llc | -- | None Listed On Document | |
| Colquitt Properties Llc | -- | -- | |
| Taub Casey C | -- | Pinnacle Title Co Lp | |
| Mayfield Eric P | -- | American Title Co | |
| Smith Joyce Parr | -- | Chicago Title |
Source: Public Records
Mortgage History
| Date | Status | Borrower | Loan Amount |
|---|---|---|---|
| Previous Owner | Taub Casey C | $236,000 | |
| Previous Owner | Mayfield Eric P | $219,200 |
Source: Public Records
Tax History Compared to Growth
Tax History
| Year | Tax Paid | Tax Assessment Tax Assessment Total Assessment is a certain percentage of the fair market value that is determined by local assessors to be the total taxable value of land and additions on the property. | Land | Improvement |
|---|---|---|---|---|
| 2025 | $3,388 | $545,659 | $240,240 | $305,419 |
| 2024 | $3,388 | $511,490 | $240,240 | $271,250 |
| 2023 | $3,388 | $528,558 | $240,240 | $288,318 |
| 2022 | $10,207 | $463,550 | $196,560 | $266,990 |
| 2021 | $10,501 | $450,541 | $229,320 | $221,221 |
| 2020 | $10,937 | $451,651 | $229,320 | $222,331 |
| 2019 | $10,586 | $418,365 | $137,360 | $281,005 |
| 2018 | $8,682 | $441,602 | $137,360 | $304,242 |
| 2017 | $11,718 | $441,602 | $137,360 | $304,242 |
| 2016 | $11,323 | $441,602 | $137,360 | $304,242 |
| 2015 | $7,111 | $441,602 | $137,360 | $304,242 |
| 2014 | $7,111 | $401,302 | $120,190 | $281,112 |
Source: Public Records
Map
Nearby Homes
- 1819 Branard St
- 1818 Colquitt St
- 1805 Sul Ross St
- 1737 Branard St
- 1844 Colquitt St
- 1849 W Main St Unit 15
- 1721 Colquitt St
- 1802 Portsmouth St
- 1826 Portsmouth St
- 3818 Hazard St
- 1842 W Alabama St
- 1844 W Alabama St
- 1849 Marshall St Unit 9
- 1849 Portsmouth St
- 1648 Colquitt St
- 1723 Marshall St
- 1824 Marshall St
- 1648 Richmond Ave
- 2027 Branard St
- 1755 Kipling St
- 4112 Woodhead St
- 4116 Woodhead St
- 4110 Woodhead St
- 1806 Colquitt St
- 4106 Woodhead St
- 1804 Colquitt St
- 1802 Colquitt St
- 1808 Colquitt St
- 1805 W Main St
- 1807 W Main St
- 1812 Colquitt St
- 1801 W Main St
- 1803 W Main St
- 1814 Colquitt St
- 4111 Woodhead St
- 4107 Woodhead St
- 1756 Colquitt St
- 1809 W Main St
- 1809 W Main St Unit Lower
- 4105 Woodhead St