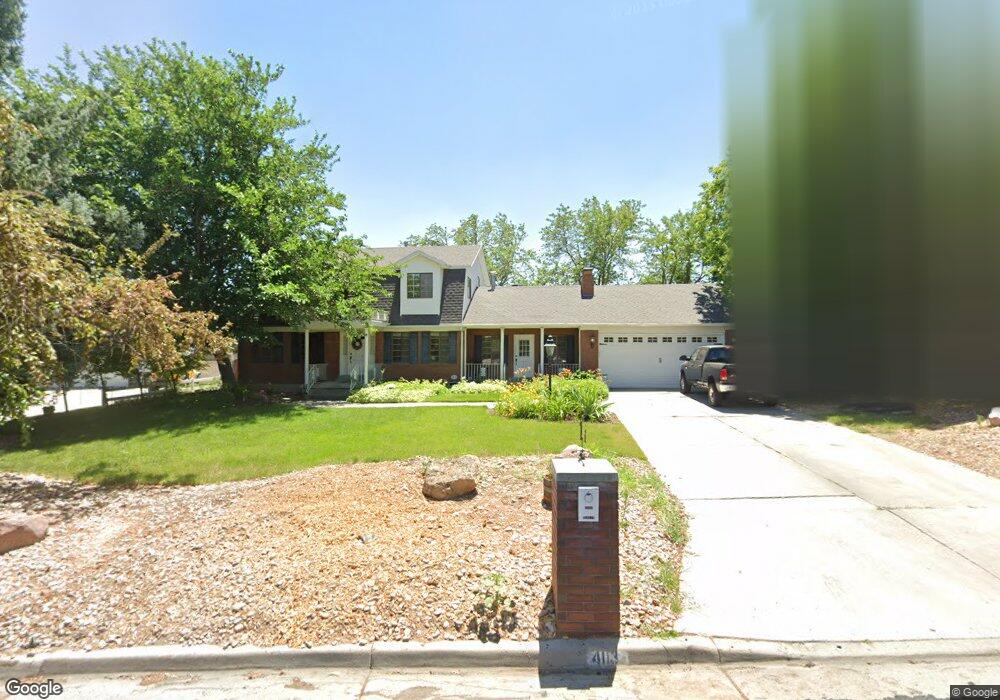
4113 Donibristle Cir South Jordan, UT 84095
Glenmoor Country Estates NeighborhoodEstimated Value: $620,125 - $707,000
3
Beds
3
Baths
2,349
Sq Ft
$278/Sq Ft
Est. Value
About This Home
This home is located at 4113 Donibristle Cir, South Jordan, UT 84095 and is currently estimated at $652,031, approximately $277 per square foot. 4113 Donibristle Cir is a home located in Salt Lake County with nearby schools including Welby Elementary School, Elk Ridge Middle School, and Itineris Early College High School.
Ownership History
Date
Name
Owned For
Owner Type
Purchase Details
Closed on
Jul 1, 2022
Sold by
Jeanne A Dehlin Trust
Bought by
Lawrence Melissa
Current Estimated Value
Home Financials for this Owner
Home Financials are based on the most recent Mortgage that was taken out on this home.
Original Mortgage
$599,500
Outstanding Balance
$570,356
Interest Rate
5.09%
Mortgage Type
New Conventional
Estimated Equity
$81,675
Purchase Details
Closed on
Sep 16, 2021
Sold by
Dehlin Jeanne A
Bought by
Dehlin Jeanne A and Jeanne A Dehlin Trust
Purchase Details
Closed on
Mar 21, 2003
Sold by
Dehlin James P and Dehlin Jeanne A
Bought by
Dehlin James Patrick and Dehlin Jeanne A
Home Financials for this Owner
Home Financials are based on the most recent Mortgage that was taken out on this home.
Original Mortgage
$160,000
Interest Rate
4.75%
Create a Home Valuation Report for This Property
The Home Valuation Report is an in-depth analysis detailing your home's value as well as a comparison with similar homes in the area
Home Values in the Area
Average Home Value in this Area
Purchase History
| Date | Buyer | Sale Price | Title Company |
|---|---|---|---|
| Lawrence Melissa | -- | Sutherland Title Company | |
| Dehlin Jeanne A | -- | None Available | |
| Dehlin James Patrick | -- | Preferred Title & Escrow Inc |
Source: Public Records
Mortgage History
| Date | Status | Borrower | Loan Amount |
|---|---|---|---|
| Open | Lawrence Melissa | $599,500 | |
| Previous Owner | Dehlin James Patrick | $160,000 | |
| Closed | Dehlin James Patrick | $65,000 |
Source: Public Records
Tax History Compared to Growth
Tax History
| Year | Tax Paid | Tax Assessment Tax Assessment Total Assessment is a certain percentage of the fair market value that is determined by local assessors to be the total taxable value of land and additions on the property. | Land | Improvement |
|---|---|---|---|---|
| 2025 | $3,190 | $616,000 | $166,400 | $449,600 |
| 2024 | $3,190 | $605,600 | $163,300 | $442,300 |
| 2023 | $3,359 | $601,700 | $158,500 | $443,200 |
| 2022 | $3,423 | $601,000 | $155,400 | $445,600 |
| 2021 | $2,623 | $422,600 | $121,100 | $301,500 |
| 2020 | $2,668 | $402,900 | $121,100 | $281,800 |
| 2019 | $2,619 | $388,800 | $114,200 | $274,600 |
| 2018 | $2,343 | $346,100 | $114,200 | $231,900 |
| 2017 | $2,213 | $320,300 | $114,200 | $206,100 |
| 2016 | $2,194 | $300,900 | $114,200 | $186,700 |
| 2015 | $1,913 | $255,100 | $116,400 | $138,700 |
| 2014 | $1,824 | $239,000 | $111,000 | $128,000 |
Source: Public Records
Map
Nearby Homes
- 9941 Birnam Woods Way
- 4072 W Ascot Downs Dr
- 4058 W Ascot Downs Dr
- 4246 W Ascot Downs Dr
- 9851 S Birdie Way
- 3928 W Kilt St
- 4208 W Chestnut View Dr
- 4424 W Skye Dr
- 10164 Birnam Woods Way
- 4554 Birdie Way
- 10376 S 3970 W
- Raddison Plan at Eagles Landing
- Wembly Plan at Eagles Landing
- Whitmore Plan at Eagles Landing
- Richmond Plan at Eagles Landing
- Regal Plan at Eagles Landing
- Wesley Plan at Eagles Landing
- 9375 S Laurel Ridge Cir
- 3651 W 10200 S Unit 11
- 10027 Birdie Way
- 4129 W Donibristle Cir
- 4129 Donibristle Cir
- 4099 Donibristle Cir
- 4099 W Donibristle Cir
- 4120 W Donibristle Cir
- 4120 Donibristle Cir
- 4095 Donibristle Cir
- 4097 Fenwick Cir
- 4145 W Donibristle Cir
- 4145 Donibristle Cir
- 4150 W Berridale Cir
- 4150 Berridale Cir
- 4138 Donibristle Cir
- 4138 W Donibristle Cir
- 4087 Fenwick Cir
- 4087 W Fenwick Cir
- 4102 Fenwick Cir
- 4149 Berridale Cir
- 4158 Berridale Cir
- 4159 W Donibristle Cir