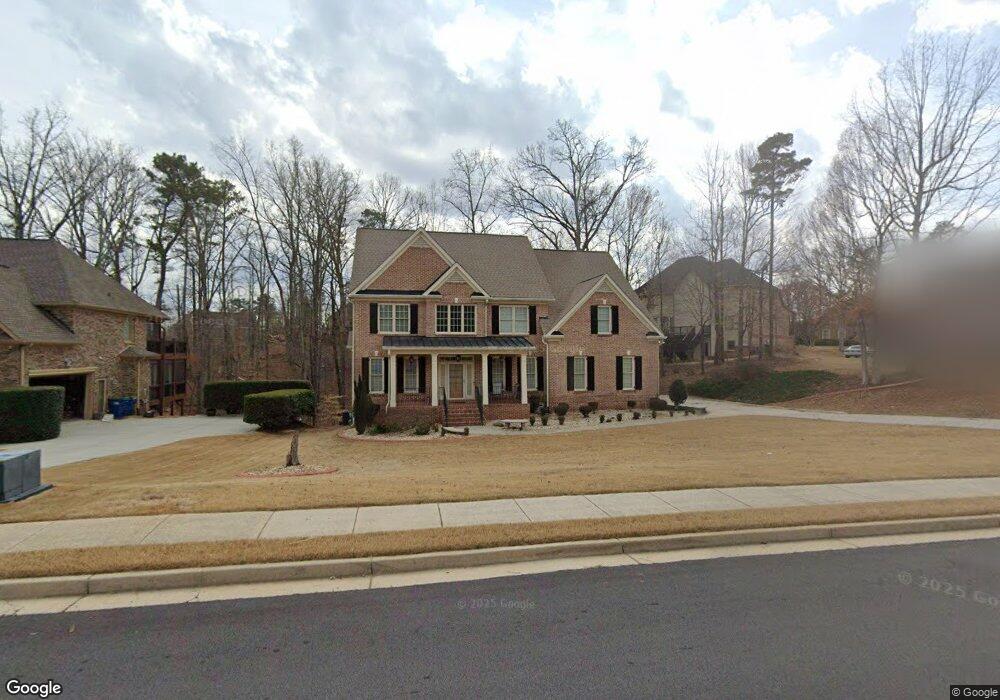
4113 Herron Trail SW Atlanta, GA 30349
Estimated Value: $493,742 - $583,000
4
Beds
4
Baths
2,984
Sq Ft
$181/Sq Ft
Est. Value
About This Home
This home is located at 4113 Herron Trail SW, Atlanta, GA 30349 and is currently estimated at $540,436, approximately $181 per square foot. 4113 Herron Trail SW is a home located in Fulton County with nearby schools including Wolf Creek Elementary, Sandtown Middle School, and Westlake High School.
Ownership History
Date
Name
Owned For
Owner Type
Purchase Details
Closed on
Mar 30, 2009
Sold by
4500 Aberdeen Llc
Bought by
Boone Steven L
Current Estimated Value
Home Financials for this Owner
Home Financials are based on the most recent Mortgage that was taken out on this home.
Original Mortgage
$100,000
Outstanding Balance
$63,892
Interest Rate
5.14%
Mortgage Type
New Conventional
Estimated Equity
$476,544
Purchase Details
Closed on
Nov 24, 2008
Sold by
Benamy Dean
Bought by
4500 Aberdeen Llc
Home Financials for this Owner
Home Financials are based on the most recent Mortgage that was taken out on this home.
Original Mortgage
$285,000
Interest Rate
6.51%
Purchase Details
Closed on
Mar 31, 2008
Sold by
Henry Darby Custom Homes Llc
Bought by
Benamy Dean
Home Financials for this Owner
Home Financials are based on the most recent Mortgage that was taken out on this home.
Original Mortgage
$330,861
Interest Rate
5.97%
Create a Home Valuation Report for This Property
The Home Valuation Report is an in-depth analysis detailing your home's value as well as a comparison with similar homes in the area
Home Values in the Area
Average Home Value in this Area
Purchase History
| Date | Buyer | Sale Price | Title Company |
|---|---|---|---|
| Boone Steven L | $270,000 | -- | |
| 4500 Aberdeen Llc | $285,000 | -- | |
| Benamy Dean | -- | -- |
Source: Public Records
Mortgage History
| Date | Status | Borrower | Loan Amount |
|---|---|---|---|
| Open | Boone Steven L | $100,000 | |
| Previous Owner | 4500 Aberdeen Llc | $285,000 | |
| Previous Owner | Benamy Dean | $330,861 |
Source: Public Records
Tax History Compared to Growth
Tax History
| Year | Tax Paid | Tax Assessment Tax Assessment Total Assessment is a certain percentage of the fair market value that is determined by local assessors to be the total taxable value of land and additions on the property. | Land | Improvement |
|---|---|---|---|---|
| 2025 | $10 | $178,560 | $40,000 | $138,560 |
| 2023 | $5,041 | $178,600 | $40,000 | $138,600 |
| 2022 | $22 | $151,200 | $36,080 | $115,120 |
| 2021 | $9 | $142,160 | $32,560 | $109,600 |
| 2020 | $296 | $127,040 | $27,360 | $99,680 |
| 2019 | $657 | $116,280 | $18,760 | $97,520 |
| 2018 | $1,344 | $121,920 | $16,960 | $104,960 |
| 2017 | $612 | $92,320 | $19,760 | $72,560 |
| 2016 | $3,763 | $92,320 | $19,760 | $72,560 |
| 2015 | $3,732 | $91,280 | $19,760 | $71,520 |
| 2014 | $3,562 | $82,600 | $19,680 | $62,920 |
Source: Public Records
Map
Nearby Homes
- 4955 Highland Lake Dr
- 225 Valerie Cir
- 4053 Herron Trail SW
- 5105 Highland Lake Dr
- 5135 Highland Lake Dr
- 3560 Union Rd SW
- 5270 Serenity Ln SW
- 5663 Eternal Dr
- 4220 Union Rd SW
- 4888 Albany Way
- 5618 Livesage Dr
- 239 Amy Overlook
- 3796 The Great Dr
- 3720 Butner Rd
- 4387 Old Fairburn Rd
- 4132 Thronbud Rd
- 4132 Thornbud Rd
- 4132 Thornbud Rd Unit LOT 124
- 4320 Union Rd SW
- 4128 Thronbud Rd
- 4117 Herron Trail SW
- 4006 Herron Pass SW Unit 2
- 4010 Herron Pass SW
- 4109 Herron Trail SW
- 4121 Herron Trail SW Unit 11C
- 5120 Halcyon Dr
- 4112 Herron Trail SW
- 2995 Herron Ln SW
- 2995 Herron Ln SW Unit 6C
- 4125 Herron Trail SW
- 4125 Herron Trail SW Unit LOT 10C
- 2991 Herron Ln SW
- 2991 Herron Ln SW Unit LOT 7C
- 4108 Herron Trail SW
- 4108 Herron Trail SW Unit 33
- 4108 Herron Trail SW
- 5115 Halcyon Dr
- 2999 Herron Ln SW
- 3903 Herron Ln SW
- 4014 Herron Pass SW