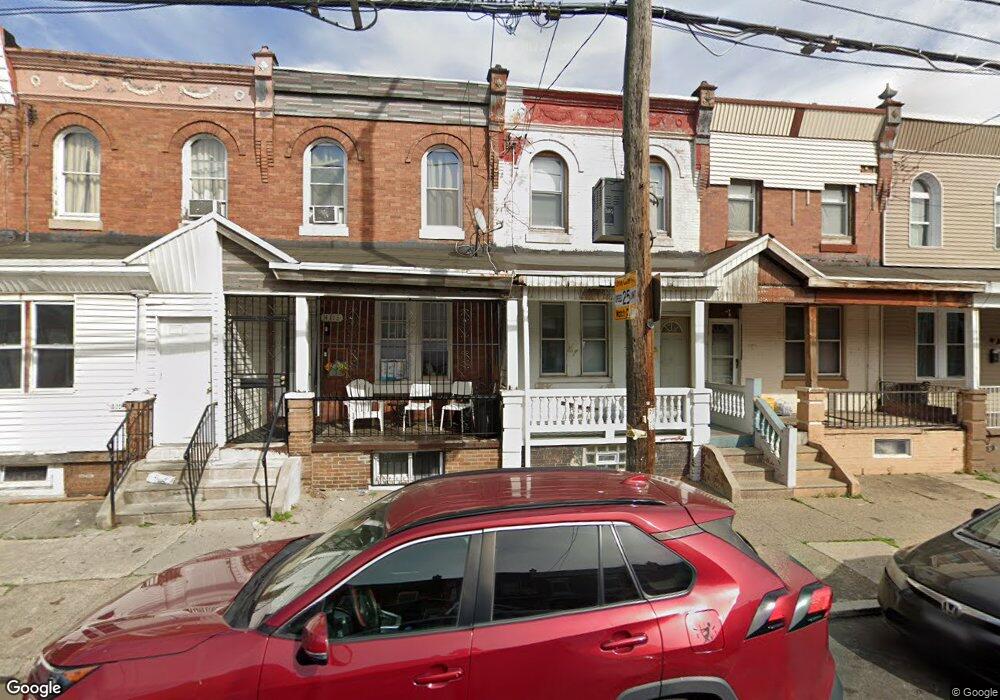
4113 N 6th St Philadelphia, PA 19140
Hunting Park NeighborhoodEstimated Value: $88,000 - $140,170
3
Beds
1
Bath
1,164
Sq Ft
$99/Sq Ft
Est. Value
About This Home
This home is located at 4113 N 6th St, Philadelphia, PA 19140 and is currently estimated at $115,543, approximately $99 per square foot. 4113 N 6th St is a home located in Philadelphia County with nearby schools including Alexander K. McClure Elementary School, Roberto Clemente Middle School, and Thomas Alva Edison High School/Fareira Skills Center.
Ownership History
Date
Name
Owned For
Owner Type
Purchase Details
Closed on
May 21, 2010
Sold by
Coelho Susana
Bought by
Pagan Isabel
Current Estimated Value
Home Financials for this Owner
Home Financials are based on the most recent Mortgage that was taken out on this home.
Original Mortgage
$64,705
Outstanding Balance
$43,750
Interest Rate
5.23%
Mortgage Type
FHA
Estimated Equity
$71,793
Purchase Details
Closed on
Dec 17, 2009
Sold by
Secretary Of Housing & Urban Development
Bought by
Coelho Susana
Purchase Details
Closed on
May 1, 2009
Sold by
Gmac Mortgage Llc
Bought by
The Secretary Of Housing & Urban Develop
Purchase Details
Closed on
Oct 14, 2008
Sold by
Laureano Victor M and Miranda Zoraida E
Bought by
Gmac Mortgage Llc
Purchase Details
Closed on
Sep 27, 1999
Sold by
Cipriano Dorothy M
Bought by
Cipriano Ronald
Create a Home Valuation Report for This Property
The Home Valuation Report is an in-depth analysis detailing your home's value as well as a comparison with similar homes in the area
Home Values in the Area
Average Home Value in this Area
Purchase History
| Date | Buyer | Sale Price | Title Company |
|---|---|---|---|
| Pagan Isabel | $65,900 | None Available | |
| Coelho Susana | $25,501 | None Available | |
| The Secretary Of Housing & Urban Develop | -- | None Available | |
| Gmac Mortgage Llc | $3,100 | None Available | |
| Cipriano Ronald | -- | -- |
Source: Public Records
Mortgage History
| Date | Status | Borrower | Loan Amount |
|---|---|---|---|
| Open | Pagan Isabel | $64,705 |
Source: Public Records
Tax History Compared to Growth
Tax History
| Year | Tax Paid | Tax Assessment Tax Assessment Total Assessment is a certain percentage of the fair market value that is determined by local assessors to be the total taxable value of land and additions on the property. | Land | Improvement |
|---|---|---|---|---|
| 2025 | $1,358 | $117,000 | $23,400 | $93,600 |
| 2024 | $1,358 | $117,000 | $23,400 | $93,600 |
| 2023 | $1,358 | $97,000 | $19,400 | $77,600 |
| 2022 | $661 | $97,000 | $19,400 | $77,600 |
| 2021 | $661 | $0 | $0 | $0 |
| 2020 | $661 | $0 | $0 | $0 |
| 2019 | $865 | $0 | $0 | $0 |
| 2018 | $792 | $0 | $0 | $0 |
| 2017 | $792 | $0 | $0 | $0 |
| 2016 | $792 | $0 | $0 | $0 |
| 2015 | $758 | $0 | $0 | $0 |
| 2014 | -- | $56,600 | $5,145 | $51,455 |
| 2012 | -- | $4,960 | $753 | $4,207 |
Source: Public Records
Map
Nearby Homes
- 4063 N 6th St
- 4057 N Fairhill St
- 4119 N 6th St
- 4164 N Fairhill St
- 4021 N Franklin St
- 3950 N Marshall St
- 4038 N Franklin St
- 4215 N 6th St
- 4111 N 8th St
- 4237 N 6th St
- 3954 N Franklin St
- 3952 N Franklin St
- 3919 N 7th St
- 4162 N 8th St
- 4234 N 7th St
- 538 W Pike St
- 4103 N 9th St
- 3920 N Franklin St
- 3853 N 6th St
- 3903 N Franklin St
- 4115 N 6th St
- 4111 N 6th St
- 4117 N 6th St
- 4109 N 6th St
- 4107 N 6th St
- 4121 N 6th St
- 4105 N 6th St
- 4123 N 6th St
- 4112 N Fairhill St
- 4103 N 6th St
- 4114 N Fairhill St
- 4108 N Fairhill St
- 4110 N Fairhill St
- 4120 N Fairhill St
- 4125 N 6th St
- 4118 N Fairhill St
- 4106 N Fairhill St
- 4101 N 6th St
- 4127 N 6th St
- 4122 N Fairhill St