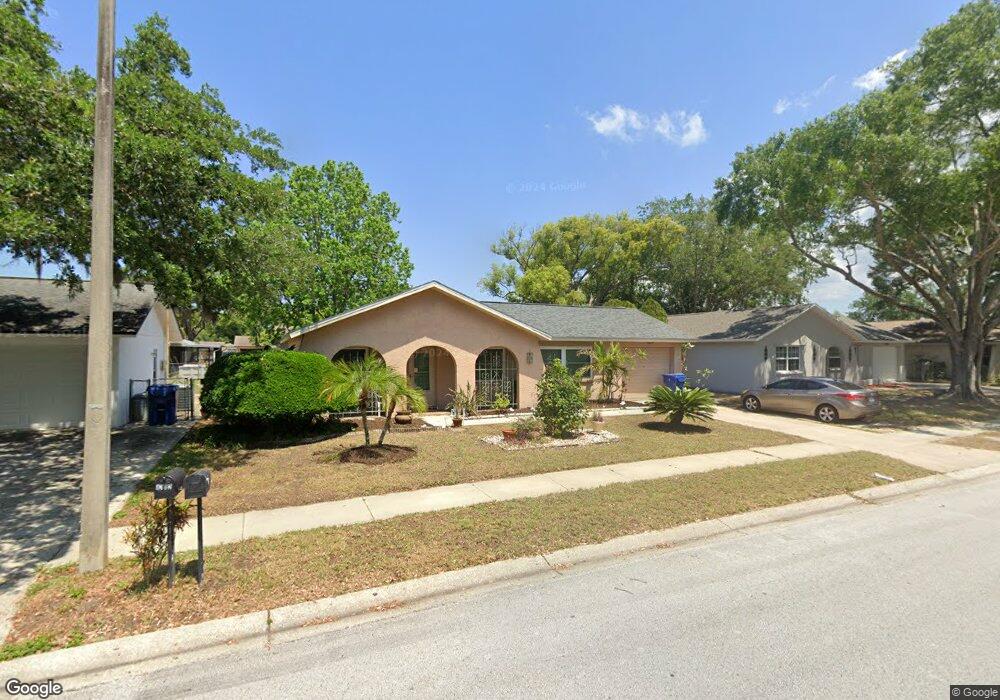
4113 Raccoon Loop Unit 1 New Port Richey, FL 34653
South New Port Richey NeighborhoodEstimated Value: $266,286 - $300,000
2
Beds
2
Baths
1,368
Sq Ft
$206/Sq Ft
Est. Value
About This Home
This home is located at 4113 Raccoon Loop Unit 1, New Port Richey, FL 34653 and is currently estimated at $281,572, approximately $205 per square foot. 4113 Raccoon Loop Unit 1 is a home located in Pasco County with nearby schools including Deer Park Elementary School, River Ridge High School, and River Ridge Middle School.
Ownership History
Date
Name
Owned For
Owner Type
Purchase Details
Closed on
Oct 19, 2018
Sold by
May James A and May Catherine
Bought by
May James A and May Catherine
Current Estimated Value
Purchase Details
Closed on
Jun 17, 2011
Sold by
Stevens Carla
Bought by
May James A and May Catherine
Home Financials for this Owner
Home Financials are based on the most recent Mortgage that was taken out on this home.
Original Mortgage
$56,000
Outstanding Balance
$38,641
Interest Rate
4.65%
Mortgage Type
New Conventional
Estimated Equity
$242,931
Purchase Details
Closed on
Dec 6, 1996
Sold by
Scumaci Donna
Bought by
Stevens Carla
Home Financials for this Owner
Home Financials are based on the most recent Mortgage that was taken out on this home.
Original Mortgage
$49,900
Interest Rate
7.83%
Mortgage Type
New Conventional
Create a Home Valuation Report for This Property
The Home Valuation Report is an in-depth analysis detailing your home's value as well as a comparison with similar homes in the area
Home Values in the Area
Average Home Value in this Area
Purchase History
| Date | Buyer | Sale Price | Title Company |
|---|---|---|---|
| May James A | -- | Attorney | |
| May James A | $70,000 | 1St Affiliated Title Service | |
| Stevens Carla | $59,900 | -- |
Source: Public Records
Mortgage History
| Date | Status | Borrower | Loan Amount |
|---|---|---|---|
| Open | May James A | $56,000 | |
| Previous Owner | Stevens Carla | $47,160 | |
| Previous Owner | Stevens Carla | $49,900 |
Source: Public Records
Tax History Compared to Growth
Tax History
| Year | Tax Paid | Tax Assessment Tax Assessment Total Assessment is a certain percentage of the fair market value that is determined by local assessors to be the total taxable value of land and additions on the property. | Land | Improvement |
|---|---|---|---|---|
| 2025 | $4,011 | $243,256 | $39,273 | $203,983 |
| 2024 | $4,011 | $250,032 | $39,273 | $210,759 |
| 2023 | $3,831 | $187,680 | $0 | $0 |
| 2022 | $3,117 | $209,948 | $32,728 | $177,220 |
| 2021 | $2,736 | $163,309 | $29,331 | $133,978 |
| 2020 | $2,468 | $142,549 | $24,700 | $117,849 |
| 2019 | $2,269 | $128,199 | $21,613 | $106,586 |
| 2018 | $2,136 | $122,862 | $21,613 | $101,249 |
| 2017 | $2,003 | $112,905 | $20,378 | $92,527 |
| 2016 | $1,805 | $100,162 | $16,981 | $83,181 |
| 2015 | $1,691 | $91,556 | $16,981 | $74,575 |
| 2014 | $1,530 | $84,789 | $16,055 | $68,734 |
Source: Public Records
Map
Nearby Homes
- 4125 Riverwood Dr
- 4236 Riverwood Dr
- 4306 Riverwood Dr
- 7924 Hardwick Dr Unit 616
- 4112 Andover St
- 4222 Northampton Dr
- 3734 Thornbush Ln
- 7910 Hardwick Dr Unit 717
- 4237 Northampton Dr
- 8041 Blue Finch Way
- 7837 Hardwick Dr Unit 324
- 4420 Northampton Dr
- 7828 Hardwick Dr Unit 924
- 4644 Sawgrass Blvd
- 7802 Hardwick Dr Unit 1116
- 7802 Hardwick Dr Unit 1126
- 8110 Damara Dr
- 7728 Balharbour Dr
- 4206 Revere Cir
- 7922 Aden Loop
- 4107 Raccoon Loop
- 8318 Bluebonnet Place Unit 1
- 8324 Bluebonnet Place
- 4150 Cotton Tail Dr Unit 1
- 4121 Raccoon Loop
- 4112 Raccoon Loop
- 4116 Raccoon Loop
- 4108 Raccoon Loop
- 8332 Bluebonnet Place
- 4120 Raccoon Loop
- 4117 Raccoon Loop
- 4125 Raccoon Loop
- 4104 Raccoon Loop
- 8340 Bluebonnet Place
- 4141 Cotton Tail Dr
- 8319 Fishhawk Ave
- 4124 Raccoon Loop
- 8315 Bluebonnet Place
- 8325 Fishhawk Ave
- 8323 Bluebonnet Place