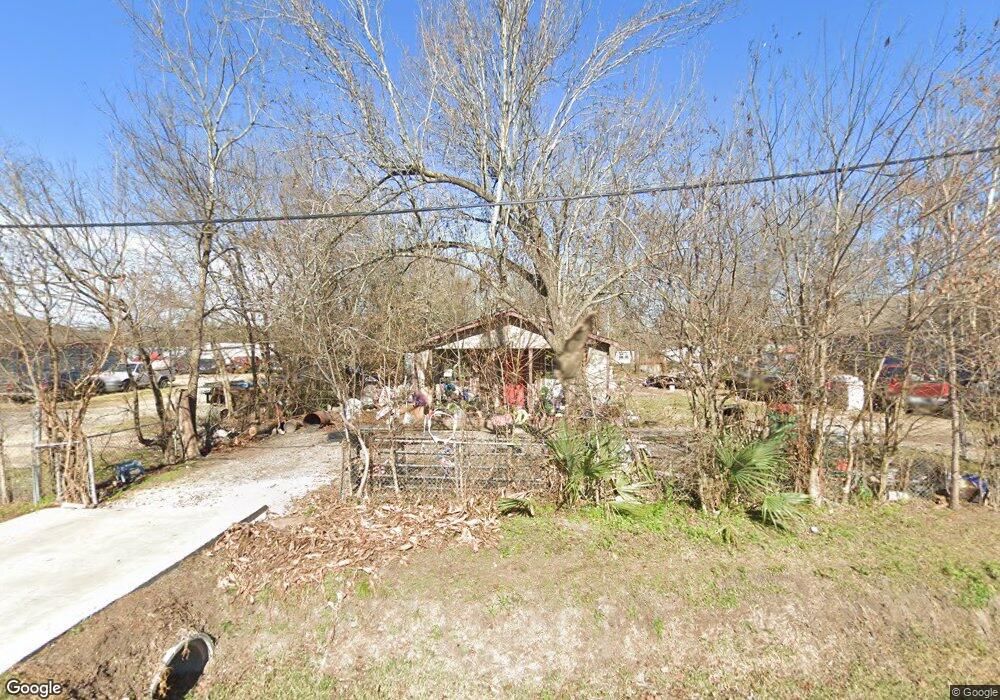
4113 Wiley Rd Houston, TX 77093
Eastex-Jensen NeighborhoodEstimated Value: $114,000 - $295,000
4
Beds
1
Bath
1,830
Sq Ft
$125/Sq Ft
Est. Value
About This Home
This home is located at 4113 Wiley Rd, Houston, TX 77093 and is currently estimated at $228,647, approximately $124 per square foot. 4113 Wiley Rd is a home located in Harris County with nearby schools including Escamilla Elementary School, Hambrick Middle School, and Macarthur Ninth Grade School.
Ownership History
Date
Name
Owned For
Owner Type
Purchase Details
Closed on
Jul 21, 2016
Sold by
Sergio Lopez
Bought by
Cardenas Noe
Current Estimated Value
Home Financials for this Owner
Home Financials are based on the most recent Mortgage that was taken out on this home.
Original Mortgage
$7,700
Outstanding Balance
$6,121
Interest Rate
3.45%
Estimated Equity
$222,526
Purchase Details
Closed on
Mar 24, 2014
Sold by
Romero Jose
Bought by
Rojas Noe Cardenas
Home Financials for this Owner
Home Financials are based on the most recent Mortgage that was taken out on this home.
Original Mortgage
$15,500
Interest Rate
4.38%
Mortgage Type
Purchase Money Mortgage
Purchase Details
Closed on
Apr 7, 2008
Sold by
Stluka Ben
Bought by
Cardenas Noe
Home Financials for this Owner
Home Financials are based on the most recent Mortgage that was taken out on this home.
Original Mortgage
$34,162
Interest Rate
6%
Mortgage Type
Purchase Money Mortgage
Purchase Details
Closed on
May 23, 2005
Sold by
Dwiggins Carol and Lawrence Carol Jean
Bought by
Marrero Marcos
Purchase Details
Closed on
Feb 2, 1990
Sold by
Leibrant Patrick A and Leibrant Janet D
Bought by
Lawrence Carol Jean
Create a Home Valuation Report for This Property
The Home Valuation Report is an in-depth analysis detailing your home's value as well as a comparison with similar homes in the area
Home Values in the Area
Average Home Value in this Area
Purchase History
| Date | Buyer | Sale Price | Title Company |
|---|---|---|---|
| Cardenas Noe | -- | -- | |
| Rojas Noe Cardenas | -- | First American Title | |
| Cardenas Noe | -- | Etc | |
| Marrero Marcos | -- | -- | |
| Lawrence Carol Jean | -- | -- |
Source: Public Records
Mortgage History
| Date | Status | Borrower | Loan Amount |
|---|---|---|---|
| Open | Cardenas Noe | $7,700 | |
| Closed | Cardenas Noe | -- | |
| Previous Owner | Rojas Noe Cardenas | $15,500 | |
| Previous Owner | Cardenas Noe | $34,162 |
Source: Public Records
Tax History Compared to Growth
Tax History
| Year | Tax Paid | Tax Assessment Tax Assessment Total Assessment is a certain percentage of the fair market value that is determined by local assessors to be the total taxable value of land and additions on the property. | Land | Improvement |
|---|---|---|---|---|
| 2025 | $4,498 | $234,667 | $117,219 | $117,448 |
| 2024 | $4,498 | $198,198 | $75,625 | $122,573 |
| 2023 | $4,498 | $200,649 | $75,625 | $125,024 |
| 2022 | $3,148 | $131,231 | $41,250 | $89,981 |
| 2021 | $2,498 | $99,448 | $20,625 | $78,823 |
| 2020 | $2,625 | $99,448 | $20,625 | $78,823 |
| 2019 | $2,507 | $90,585 | $16,500 | $74,085 |
| 2018 | $942 | $90,585 | $16,500 | $74,085 |
| 2017 | $2,253 | $90,585 | $16,500 | $74,085 |
| 2016 | $2,048 | $90,585 | $16,500 | $74,085 |
| 2015 | $1,338 | $90,585 | $16,500 | $74,085 |
| 2014 | $1,338 | $63,819 | $16,500 | $47,319 |
Source: Public Records
Map
Nearby Homes
- 4509 Haywood St
- 3709 Gager St
- 4809 Edgewater Dr
- 0 Haywood St Unit 63273227
- 7631 Hirsch Rd
- 7902 S Lockwood Dr
- 0.0 Friendly Rd
- 3807 Hage St
- 4918 Langley Rd
- 3806 Hage St
- 4102 Kinkaid St
- 5022 Bretshire Dr
- 3202 Parker Rd
- 5413 Glen Nook Dr
- 4514 Wyte Ln
- 5130 Farb Dr
- 5418 Parker Rd
- 5123 Francine Ln
- 3809 Turner Dr
- 5621 Haywood St