M
Seller's Agent in 2020
Mike Parcher
John L Scott
(360) 739-0857
40 Total Sales


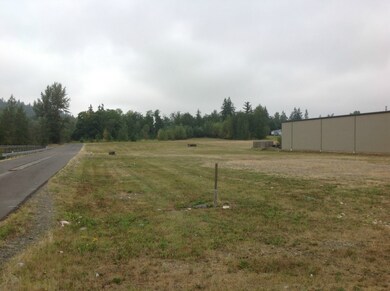
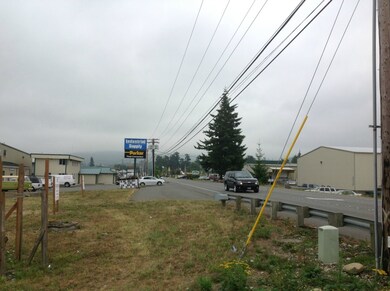
Zoning Class is General Manufacturing. Prime property near corner of Hannegan and East Bakerview. EZ access to I-5 and Lynden. Near Whidbey Island Bank and DeWaard & Bode. Excellent location in popular area. Lot sizes are actually larger than listed. Square footage listed is "usable square footage" as calculated by engineer.
Source: Northwest Multiple Listing Service (NWMLS)
MLS#: NWM681911
| Date | Type | Sale Price | Title Company |
|---|---|---|---|
| Warranty Deed | $1,060,000 | Whatcom Land Title | |
| Warranty Deed | $113,279 | Chicago Title Insurance |
| Date | Status | Loan Amount | Loan Type |
|---|---|---|---|
| Previous Owner | $250,000 | Construction |
| Date | Event | Price | Change | Sq Ft Price |
|---|---|---|---|---|
| 05/22/2020 05/22/20 | Sold | $1,060,000 | -11.6% | $530 / Sq Ft |
| 04/28/2020 04/28/20 | Pending | -- | -- | -- |
| 02/28/2020 02/28/20 | For Sale | $1,199,000 | +958.4% | $600 / Sq Ft |
| 01/15/2016 01/15/16 | Sold | $113,280 | -25.0% | -- |
| 01/07/2016 01/07/16 | Pending | -- | -- | -- |
| 08/14/2014 08/14/14 | For Sale | $151,040 | -- | -- |
| Year | Tax Paid | Tax Assessment Tax Assessment Total Assessment is a certain percentage of the fair market value that is determined by local assessors to be the total taxable value of land and additions on the property. | Land | Improvement |
|---|---|---|---|---|
| 2024 | $10,434 | $1,341,412 | $422,034 | $919,378 |
| 2023 | $10,434 | $1,341,412 | $422,034 | $919,378 |
| 2022 | $8,606 | $1,056,229 | $332,310 | $723,919 |
| 2021 | $8,060 | $926,517 | $291,500 | $635,017 |
| 2020 | $5,301 | $818,930 | $199,547 | $619,383 |
| 2019 | $4,684 | $520,619 | $146,334 | $374,285 |
| 2018 | $3,654 | $461,192 | $129,631 | $331,561 |
| 2017 | $1,266 | $307,652 | $121,379 | $186,273 |
| 2016 | $2,349 | $111,357 | $111,357 | $0 |
| 2015 | $2,339 | $215,122 | $215,122 | $0 |
| 2014 | -- | $207,277 | $207,277 | $0 |
| 2013 | -- | $207,277 | $207,277 | $0 |
M
Seller's Agent in 2020
Mike Parcher
John L Scott
(360) 739-0857
40 Total Sales
J
Buyer's Agent in 2020
Jim Sands
RE/MAX Whatcom County

Seller's Agent in 2016
Greg Grant
Coldwell Banker Bain
(360) 224-7253
18 Total Sales
Source: Northwest Multiple Listing Service (NWMLS)
MLS Number: NWM681911
APN: 380308-388056-0000
Disclaimer: Certain information contained herein is derived from information provided by parties other than Homes.com. All information provided is deemed reliable, but is not guaranteed to be accurate and should be independently verified.
![]() All data is obtained from various sources and may not have been verified by broker or MLS GRID. Supplied Open House Information is subject to change without notice. All information should be independently reviewed and verified for accuracy. Properties may or may not be listed by the office/agent presenting the information. Listing information is provided by the Northwest Multiple Listing Service (NWMLS). Property information is based on available data that may include MLS information, county records, and other sources. Listings marked with the 3 tree icon and provided by NWMLS. All properties are subject to prior sale or withdrawal. IDX information is provided exclusively for consumers’ personal noncommercial use, that it may not be used for any purpose other than to identify prospective properties consumers may be interested in purchasing, that the data is deemed reliable but is not guaranteed by MLS GRID. ©2025 NWMLS.
All data is obtained from various sources and may not have been verified by broker or MLS GRID. Supplied Open House Information is subject to change without notice. All information should be independently reviewed and verified for accuracy. Properties may or may not be listed by the office/agent presenting the information. Listing information is provided by the Northwest Multiple Listing Service (NWMLS). Property information is based on available data that may include MLS information, county records, and other sources. Listings marked with the 3 tree icon and provided by NWMLS. All properties are subject to prior sale or withdrawal. IDX information is provided exclusively for consumers’ personal noncommercial use, that it may not be used for any purpose other than to identify prospective properties consumers may be interested in purchasing, that the data is deemed reliable but is not guaranteed by MLS GRID. ©2025 NWMLS.
Based on information submitted to the MLS GRID