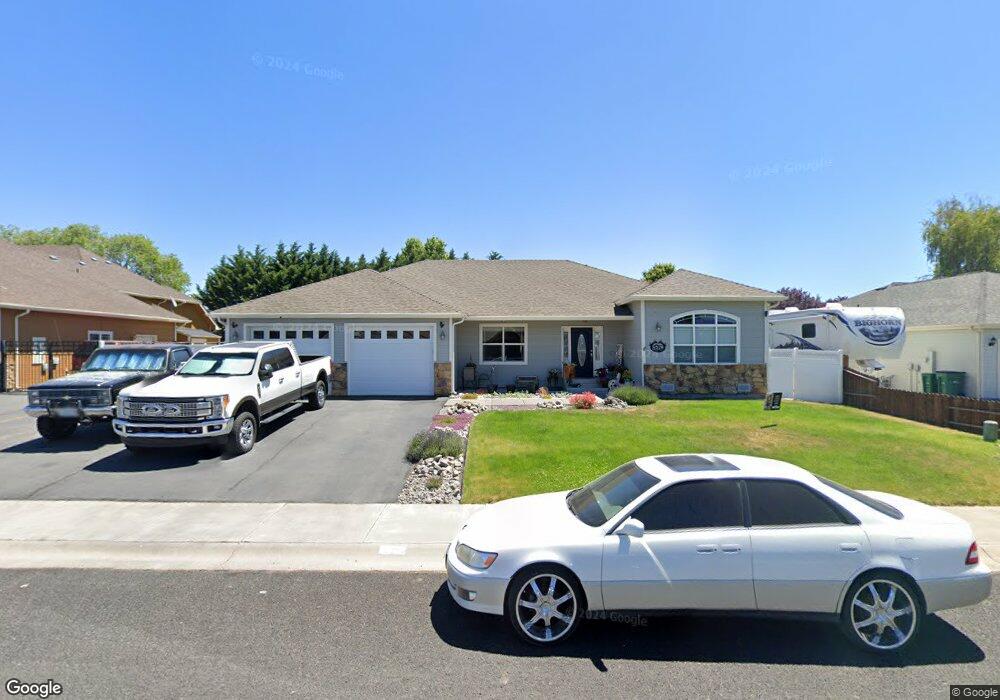
4115 El Cerrito Way Klamath Falls, OR 97603
Estimated Value: $435,000 - $453,312
4
Beds
2
Baths
2,048
Sq Ft
$217/Sq Ft
Est. Value
About This Home
This home is located at 4115 El Cerrito Way, Klamath Falls, OR 97603 and is currently estimated at $444,156, approximately $216 per square foot. 4115 El Cerrito Way is a home located in Klamath County with nearby schools including Ferguson Elementary School, Henley Middle School, and Henley High School.
Ownership History
Date
Name
Owned For
Owner Type
Purchase Details
Closed on
Feb 22, 2016
Sold by
Nanneman Jared
Bought by
Nanneman Jared and Nanneman Tonya
Current Estimated Value
Purchase Details
Closed on
Nov 30, 2010
Sold by
Harris Kenneth H and Harris Desiree M
Bought by
Citimortgage Inc
Purchase Details
Closed on
Jan 17, 2007
Sold by
Keller Stephen J and Hoppe Rebecca Ann
Bought by
Joe Keller Construction Inc
Home Financials for this Owner
Home Financials are based on the most recent Mortgage that was taken out on this home.
Original Mortgage
$267,500
Interest Rate
6.11%
Mortgage Type
New Conventional
Purchase Details
Closed on
Jan 11, 2007
Sold by
Joe Keller Construction Inc
Bought by
Harris Kenneth H and Harris Desiree M
Home Financials for this Owner
Home Financials are based on the most recent Mortgage that was taken out on this home.
Original Mortgage
$267,500
Interest Rate
6.11%
Mortgage Type
New Conventional
Create a Home Valuation Report for This Property
The Home Valuation Report is an in-depth analysis detailing your home's value as well as a comparison with similar homes in the area
Home Values in the Area
Average Home Value in this Area
Purchase History
| Date | Buyer | Sale Price | Title Company |
|---|---|---|---|
| Nanneman Jared | -- | None Available | |
| Citimortgage Inc | $196,000 | None Available | |
| Joe Keller Construction Inc | $70,000 | Amerititle | |
| Harris Kenneth H | $334,387 | Multiple |
Source: Public Records
Mortgage History
| Date | Status | Borrower | Loan Amount |
|---|---|---|---|
| Previous Owner | Harris Kenneth H | $267,500 |
Source: Public Records
Tax History Compared to Growth
Tax History
| Year | Tax Paid | Tax Assessment Tax Assessment Total Assessment is a certain percentage of the fair market value that is determined by local assessors to be the total taxable value of land and additions on the property. | Land | Improvement |
|---|---|---|---|---|
| 2024 | $3,643 | $246,540 | -- | -- |
| 2023 | $3,493 | $221,070 | $62,240 | $158,830 |
| 2022 | $3,376 | $232,390 | $0 | $0 |
| 2021 | $3,351 | $225,630 | $0 | $0 |
| 2020 | $2,641 | $219,060 | $0 | $0 |
| 2019 | $3,162 | $212,680 | $0 | $0 |
| 2018 | $2,502 | $206,490 | $0 | $0 |
| 2017 | $2,439 | $200,480 | $0 | $0 |
| 2016 | $2,375 | $194,650 | $0 | $0 |
| 2015 | $2,313 | $188,990 | $0 | $0 |
| 2014 | $2,314 | $183,490 | $0 | $0 |
| 2013 | -- | $178,150 | $0 | $0 |
Source: Public Records
Map
Nearby Homes
- 4114 El Cerrito Way
- 7016 Hager Ln
- 3934 El Cerrito Way
- 3723 La Habra Way
- 3918 Monrovia Way
- 4410 Oregon 39
- 6324 Altadena Dr
- 4538 Bellm Dr
- 4135 Monrovia Way
- 6404 Ventura Dr
- 4036 Valinda Way
- 4621 Alt Ct
- 3634 La Marada Way
- 7446 Boyd Place
- 7649 Booth Rd
- 4762 Sayler St
- 3323 Barnes Way
- 3311 Barnes Way
- 6506 Sarah Cir
- 5819 Southgate Dr
- 4109 El Cerrito Way
- 4121 El Cerrito Way
- 4236 Mels Place
- 4240 Mels Place
- 4240 Mel's
- 4003 El Cerrito Way
- 4227 El Cerrito Way
- 4248 Mels Place
- 4120 El Cerrito Way
- 4106 El Cerrito Way
- 4228 El Cerrito Way
- 4252 Mels Place
- 4002 El Cerrito Way
- 3947 El Cerrito Way
- 4229 El Cerrito Way
- 4230 El Cerrito Way
- 4260 Mels Place
- 3946 El Cerrito Way
- 4239 Mels Place
- 4243 Mels Place