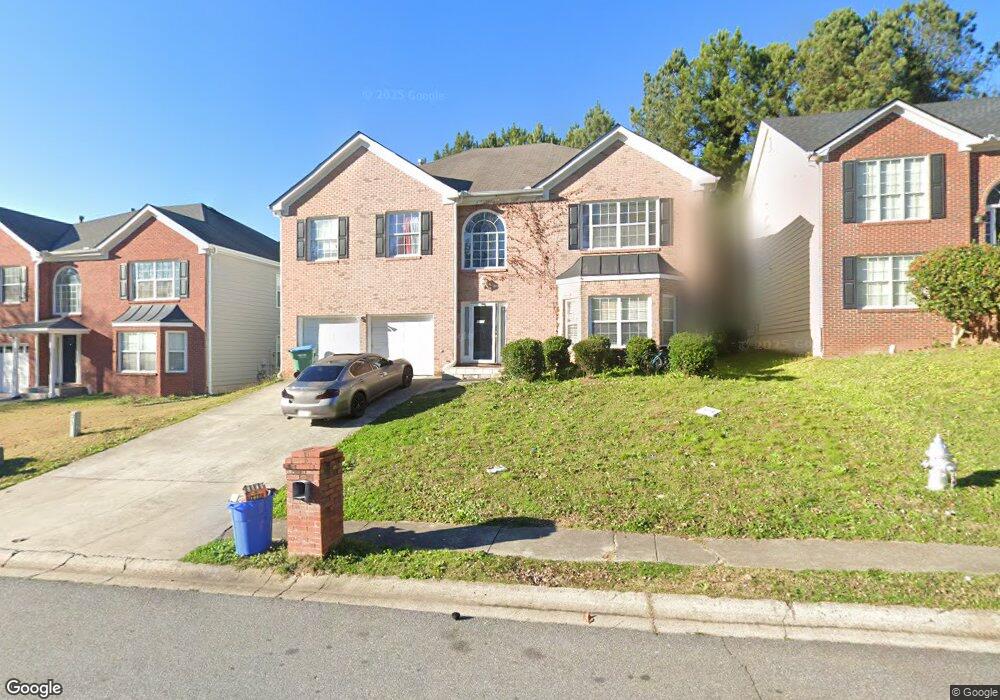
4115 Fallbrook Dr Unit 2 Duluth, GA 30096
Estimated Value: $488,000 - $510,000
5
Beds
4
Baths
3,184
Sq Ft
$157/Sq Ft
Est. Value
About This Home
This home is located at 4115 Fallbrook Dr Unit 2, Duluth, GA 30096 and is currently estimated at $498,333, approximately $156 per square foot. 4115 Fallbrook Dr Unit 2 is a home located in Gwinnett County with nearby schools including Charles Brant Chesney Elementary School, Duluth Middle School, and Duluth High School.
Ownership History
Date
Name
Owned For
Owner Type
Purchase Details
Closed on
Nov 20, 2003
Sold by
Hashambhai Sadruddin and Hashambhai Shehnaz S
Bought by
Samani Yasmin D
Current Estimated Value
Home Financials for this Owner
Home Financials are based on the most recent Mortgage that was taken out on this home.
Original Mortgage
$145,500
Outstanding Balance
$66,826
Interest Rate
5.98%
Mortgage Type
New Conventional
Estimated Equity
$431,507
Purchase Details
Closed on
Oct 13, 1998
Sold by
Hashambhai Sadruddin
Bought by
Hashambhai Sadruddin and Hashambhai Shehn
Home Financials for this Owner
Home Financials are based on the most recent Mortgage that was taken out on this home.
Original Mortgage
$130,400
Interest Rate
6.61%
Mortgage Type
New Conventional
Purchase Details
Closed on
Mar 25, 1996
Sold by
Melendy Hill Homes Inc
Bought by
Kilcrease Clarence E
Create a Home Valuation Report for This Property
The Home Valuation Report is an in-depth analysis detailing your home's value as well as a comparison with similar homes in the area
Home Values in the Area
Average Home Value in this Area
Purchase History
| Date | Buyer | Sale Price | Title Company |
|---|---|---|---|
| Samani Yasmin D | $194,000 | -- | |
| Hashambhai Sadruddin | -- | -- | |
| Hashambhai Sadruddin | $163,000 | -- | |
| Kilcrease Clarence E | $152,400 | -- |
Source: Public Records
Mortgage History
| Date | Status | Borrower | Loan Amount |
|---|---|---|---|
| Open | Samani Yasmin D | $145,500 | |
| Previous Owner | Hashambhai Sadruddin | $130,400 | |
| Closed | Kilcrease Clarence E | $0 |
Source: Public Records
Tax History
| Year | Tax Paid | Tax Assessment Tax Assessment Total Assessment is a certain percentage of the fair market value that is determined by local assessors to be the total taxable value of land and additions on the property. | Land | Improvement |
|---|---|---|---|---|
| 2025 | $8,128 | $221,840 | $34,000 | $187,840 |
| 2024 | $6,883 | $184,000 | $30,000 | $154,000 |
| 2023 | $6,883 | $174,320 | $26,000 | $148,320 |
| 2022 | $6,509 | $174,320 | $26,000 | $148,320 |
| 2021 | $4,749 | $122,720 | $20,000 | $102,720 |
| 2020 | $4,777 | $122,720 | $20,000 | $102,720 |
| 2019 | $4,601 | $122,720 | $20,000 | $102,720 |
| 2018 | $4,041 | $106,560 | $16,000 | $90,560 |
| 2016 | $3,351 | $86,400 | $15,200 | $71,200 |
| 2015 | $3,386 | $86,400 | $12,000 | $74,400 |
| 2014 | $2,448 | $59,600 | $12,000 | $47,600 |
Source: Public Records
Map
Nearby Homes
- 4091 Beaver Oaks Dr
- 2347 Fawn Hollow Ct Unit 1
- 4240 Berkeley Mill Ln
- 4270 Berkeley Mill Ln
- 4300 Wildridge Dr
- 4220 E Meadow Dr
- 4110 Megan Rd Unit 2
- 2239 Dandridge Dr
- 2251 Grovemont Dr
- 3614 Gainesway Trace
- 3593 Gainesway Ct
- 2152 Graywell Ln
- 2535 Rhoanoke Dr
- 2207 Hopkins Terrace
- 3945 Genoa Ct
- 4328 Buckingham Place
- 3053 Hartright Bend Ct
- 4569 Iroquois Trail
- 2852 Inverloch Cir
- 3049 Hartright Bend Ct
- 4105 Fallbrook Dr
- 4105 Fallbrook Dr
- 2356 Shadow Pines Ct
- 2359 Fallbrook Ct
- 4135 Fallbrook Dr
- 2376 Shadow Pines Ct
- 4110 Fallbrook Dr
- 4120 Fallbrook Dr
- 2369 Fallbrook Ct Unit 2
- 4100 Fallbrook Dr
- 4130 Fallbrook Dr
- 4090 Fallbrook Dr
- 4085 Fallbrook Dr
- 2341 Shadow Pines Ct
- 2351 Shadow Pines Ct
- 4140 Fallbrook Dr
- 2386 Shadow Pines Ct Unit 2
- 2361 Shadow Pines Ct Unit 2
- 4080 Fallbrook Dr Unit 2
- 4155 Fallbrook Dr
Your Personal Tour Guide
Ask me questions while you tour the home.