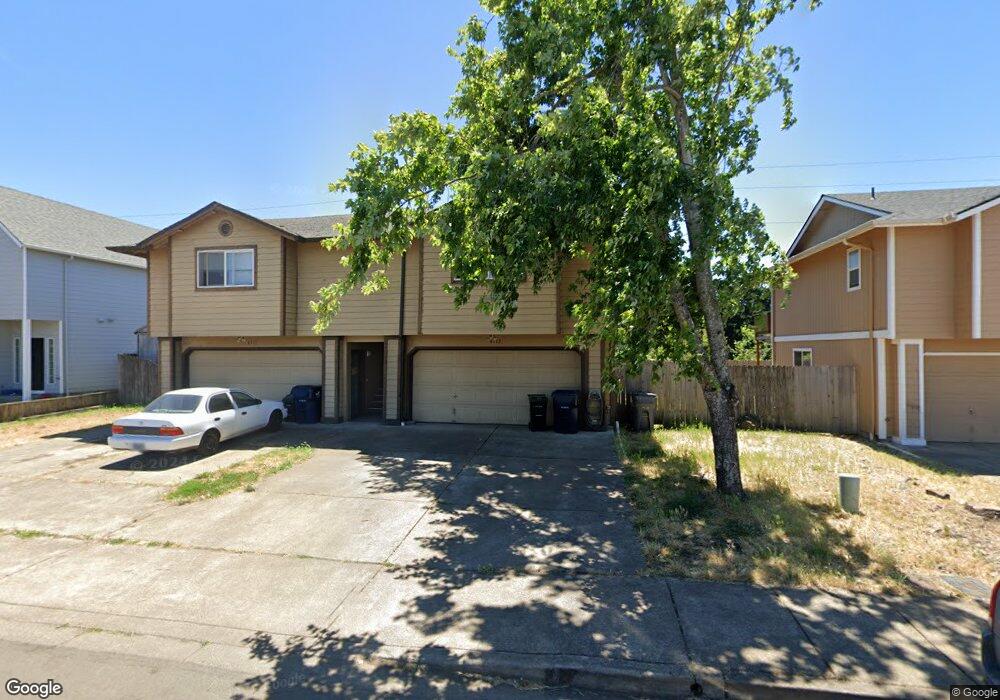
4115 Forsythia St Springfield, OR 97478
East Springfield NeighborhoodEstimated Value: $406,000 - $443,810
4
Beds
4
Baths
1,295
Sq Ft
$330/Sq Ft
Est. Value
About This Home
This home is located at 4115 Forsythia St, Springfield, OR 97478 and is currently estimated at $427,203, approximately $329 per square foot. 4115 Forsythia St is a home located in Lane County with nearby schools including Douglas Gardens Elementary School, Agnes Stewart Middle School, and Springfield High School.
Ownership History
Date
Name
Owned For
Owner Type
Purchase Details
Closed on
Sep 14, 2018
Sold by
Geren Brian L
Bought by
Geren Brian L and The Brian L Geren Living Trust
Current Estimated Value
Purchase Details
Closed on
Feb 22, 2005
Sold by
Wright Donald G and Wright Janet C
Bought by
Geren Brian L
Home Financials for this Owner
Home Financials are based on the most recent Mortgage that was taken out on this home.
Original Mortgage
$108,500
Outstanding Balance
$55,076
Interest Rate
5.73%
Mortgage Type
Purchase Money Mortgage
Estimated Equity
$372,127
Purchase Details
Closed on
Aug 20, 2003
Sold by
Wright Donald G and Wright Janet Charlene
Bought by
Wright Donald G and Wright Janet C
Home Financials for this Owner
Home Financials are based on the most recent Mortgage that was taken out on this home.
Original Mortgage
$100,000
Interest Rate
5.46%
Mortgage Type
Unknown
Purchase Details
Closed on
Sep 11, 2001
Sold by
Wright Donald G and Wright Janet C
Bought by
Wright Donald G and Wright Janet Charlene
Create a Home Valuation Report for This Property
The Home Valuation Report is an in-depth analysis detailing your home's value as well as a comparison with similar homes in the area
Home Values in the Area
Average Home Value in this Area
Purchase History
| Date | Buyer | Sale Price | Title Company |
|---|---|---|---|
| Geren Brian L | -- | None Available | |
| Geren Brian L | $155,000 | Western Pioneer Title | |
| Wright Donald G | -- | Western Title & Escrow Co | |
| Wright Donald G | -- | -- |
Source: Public Records
Mortgage History
| Date | Status | Borrower | Loan Amount |
|---|---|---|---|
| Open | Geren Brian L | $108,500 | |
| Previous Owner | Wright Donald G | $100,000 |
Source: Public Records
Tax History Compared to Growth
Tax History
| Year | Tax Paid | Tax Assessment Tax Assessment Total Assessment is a certain percentage of the fair market value that is determined by local assessors to be the total taxable value of land and additions on the property. | Land | Improvement |
|---|---|---|---|---|
| 2024 | $4,423 | $238,008 | -- | -- |
| 2023 | $4,423 | $231,076 | $0 | $0 |
| 2022 | $4,096 | $224,346 | $0 | $0 |
| 2021 | $4,023 | $217,812 | $0 | $0 |
| 2020 | $3,905 | $211,468 | $0 | $0 |
| 2019 | $3,788 | $205,309 | $0 | $0 |
| 2018 | $3,570 | $193,524 | $0 | $0 |
| 2017 | $3,420 | $193,524 | $0 | $0 |
| 2016 | $3,310 | $187,887 | $0 | $0 |
| 2015 | $3,250 | $182,415 | $0 | $0 |
| 2014 | $3,189 | $177,102 | $0 | $0 |
Source: Public Records
Map
Nearby Homes
- 4131 Forsythia St
- 4072 Forsythia St
- 0 Filbert Ln
- 4137 Bluebelle Way
- 4133 Bluebelle Way
- 4324 Forsythia St
- 443 S 43rd St
- 647 S 44th St
- 848 S 44th St
- 455 S 38th St
- 3720 Virginia Ave
- 4459 Glacier St
- 4457 Aster St
- 4217 Cole Way
- 4187 Richland St
- 225 41st St Unit 36
- 4454 Jasper Rd
- 3818 Longridge Dr
- 327 S 46th St
- 4635 Daisy St
- 4117 Forsythia St
- 4119 Forsythia St
- 4109 Forsythia St
- 4123 Forsythia St
- 4105 Forsythia St
- 4114 Forsythia St
- 635 S 41st Ct
- 4108 Forsythia St
- 4124 Forsythia St
- 4127 Forsythia St
- 4101 Forsythia St
- 4104 Forsythia St
- 4102 Forsythia St
- 4132 Forsythia St
- 619 S 41st Ct
- 630 S 41st Ct
- 4095 Forsythia St
- 603-611, 613 615 617 South 41st Ct
- 626 S 41st Ct
- 615 S 41st Ct