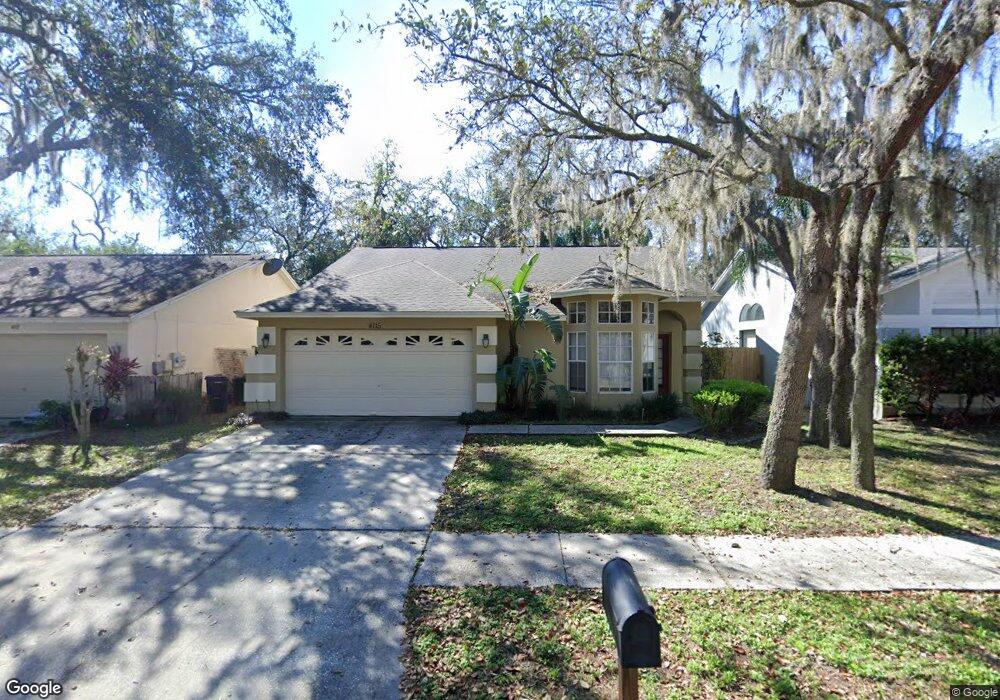
4115 Quail Briar Dr Unit 3 Valrico, FL 33596
Estimated Value: $295,000 - $358,000
3
Beds
2
Baths
2,104
Sq Ft
$155/Sq Ft
Est. Value
About This Home
This home is located at 4115 Quail Briar Dr Unit 3, Valrico, FL 33596 and is currently estimated at $326,689, approximately $155 per square foot. 4115 Quail Briar Dr Unit 3 is a home located in Hillsborough County with nearby schools including Alafia Elementary School, Burns Middle School, and Bloomingdale High School.
Ownership History
Date
Name
Owned For
Owner Type
Purchase Details
Closed on
Feb 2, 2017
Sold by
Daren S Meginnis As Managing Member Of 9
Bought by
Meginnis Daren Scot
Current Estimated Value
Purchase Details
Closed on
Feb 1, 2017
Bought by
Mcginnis Daren Scot Trustee
Purchase Details
Closed on
Oct 29, 2010
Sold by
Mcginnis Daren S
Bought by
9399 Llc
Purchase Details
Closed on
Aug 17, 1999
Sold by
Gearhart Georgia A
Bought by
Mcginnis Daren S
Home Financials for this Owner
Home Financials are based on the most recent Mortgage that was taken out on this home.
Original Mortgage
$88,200
Interest Rate
7.7%
Mortgage Type
New Conventional
Purchase Details
Closed on
Jul 26, 1993
Sold by
M I Schottenstein Homes Inc
Bought by
Suarez Maria S and Hoyland Jeffrey A
Home Financials for this Owner
Home Financials are based on the most recent Mortgage that was taken out on this home.
Original Mortgage
$83,481
Interest Rate
7.39%
Mortgage Type
FHA
Create a Home Valuation Report for This Property
The Home Valuation Report is an in-depth analysis detailing your home's value as well as a comparison with similar homes in the area
Home Values in the Area
Average Home Value in this Area
Purchase History
| Date | Buyer | Sale Price | Title Company |
|---|---|---|---|
| Meginnis Daren Scot | -- | Attorney | |
| Mcginnis Daren Scot Trustee | $100 | -- | |
| 9399 Llc | $67,000 | Attorney | |
| Mcginnis Daren S | $98,000 | -- | |
| Suarez Maria S | $84,500 | -- |
Source: Public Records
Mortgage History
| Date | Status | Borrower | Loan Amount |
|---|---|---|---|
| Previous Owner | Mcginnis Daren S | $90,750 | |
| Previous Owner | Mcginnis Daren S | $88,200 | |
| Previous Owner | Suarez Maria S | $83,481 |
Source: Public Records
Tax History Compared to Growth
Tax History
| Year | Tax Paid | Tax Assessment Tax Assessment Total Assessment is a certain percentage of the fair market value that is determined by local assessors to be the total taxable value of land and additions on the property. | Land | Improvement |
|---|---|---|---|---|
| 2024 | $4,519 | $224,692 | $53,955 | $170,737 |
| 2023 | $4,169 | $207,404 | $49,050 | $158,354 |
| 2022 | $3,853 | $201,963 | $39,240 | $162,723 |
| 2021 | $3,462 | $156,646 | $29,430 | $127,216 |
| 2020 | $3,168 | $142,720 | $29,430 | $113,290 |
| 2019 | $3,112 | $141,240 | $28,204 | $113,036 |
| 2018 | $2,958 | $134,826 | $0 | $0 |
| 2017 | $2,764 | $123,282 | $0 | $0 |
| 2016 | $2,612 | $114,128 | $0 | $0 |
| 2015 | $2,495 | $105,992 | $0 | $0 |
| 2014 | $2,327 | $97,592 | $0 | $0 |
| 2013 | -- | $91,404 | $0 | $0 |
Source: Public Records
Map
Nearby Homes
- 2603 Shilo Ct
- 2561 Regal River Rd
- 2536 Mason Oaks Dr
- 2527 Wrencrest Cir
- 2318 Kenwick Dr
- 2515 Centennial Falcon Dr
- 2916 Shetland Ridge Dr
- 4411 Culbreath Rd
- 2539 Centennial Falcon Dr
- 2903 Williams Blvd
- 3515 Springville Dr
- 2306 Colusa Ln
- 2625 Brookville Dr
- 3810 Hollow Wood Dr
- 3703 Lithia Pinecrest Rd
- 2630 Allwood Ave
- 3834 Cold Creek Dr
- 2703 Brookville Dr
- 2512 Allwood Ave
- 2505 Allwood Ave
- 4113 Quail Briar Dr
- 4117 Quail Briar Dr
- 4119 Quail Briar Dr
- 4111 Quail Briar Dr
- 4021 Levonshire Place
- 2630 Hideaway Ln
- 4121 Quail Briar Dr
- 4109 Quail Briar Dr Unit 3
- 4022 Fontana Place
- 4019 Levonshire Place
- 4022 Levonshire Place
- 4123 Quail Briar Dr
- 4107 Quail Briar Dr
- 4020 Fontana Place
- 4020 Levonshire Place
- 4017 Levonshire Place
- 4105 Quail Briar Dr
- 4018 Fontana Place
- 4132 Quail Briar Dr
- 4125 Quail Briar Dr