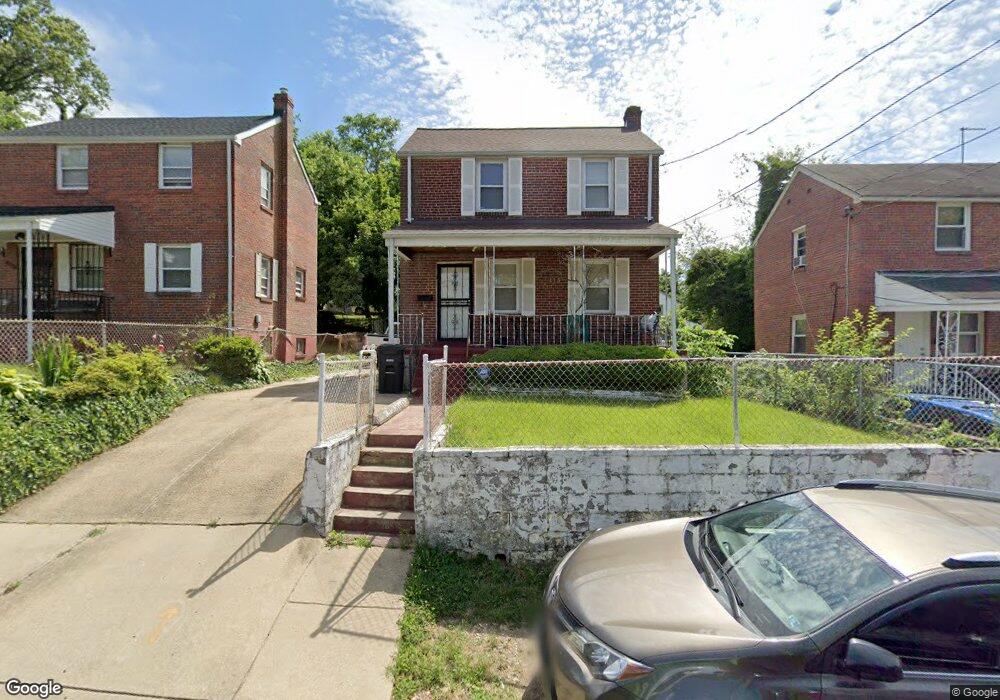
4115 Vine St Capitol Heights, MD 20743
Estimated Value: $235,000 - $314,000
Studio
1
Bath
1,018
Sq Ft
$287/Sq Ft
Est. Value
About This Home
This home is located at 4115 Vine St, Capitol Heights, MD 20743 and is currently estimated at $291,750, approximately $286 per square foot. 4115 Vine St is a home located in Prince George's County with nearby schools including Bradbury Heights Elementary School, Drew Freeman Middle School, and Suitland High School.
Ownership History
Date
Name
Owned For
Owner Type
Purchase Details
Closed on
Jun 20, 2005
Sold by
Littlejohn Margaret E
Bought by
Littlejohn Sophia
Current Estimated Value
Home Financials for this Owner
Home Financials are based on the most recent Mortgage that was taken out on this home.
Original Mortgage
$116,960
Outstanding Balance
$64,516
Interest Rate
6.65%
Mortgage Type
Adjustable Rate Mortgage/ARM
Estimated Equity
$227,234
Purchase Details
Closed on
Nov 12, 2004
Sold by
Littlejohn Margaret E
Bought by
Littlejohn Sophia
Home Financials for this Owner
Home Financials are based on the most recent Mortgage that was taken out on this home.
Original Mortgage
$116,960
Interest Rate
6.65%
Mortgage Type
Adjustable Rate Mortgage/ARM
Purchase Details
Closed on
Apr 30, 2002
Sold by
Powell James
Bought by
Littlejohn Margaret E
Purchase Details
Closed on
Jun 5, 1997
Sold by
Powell James
Bought by
Powell James
Create a Home Valuation Report for This Property
The Home Valuation Report is an in-depth analysis detailing your home's value as well as a comparison with similar homes in the area
Home Values in the Area
Average Home Value in this Area
Purchase History
| Date | Buyer | Sale Price | Title Company |
|---|---|---|---|
| Littlejohn Sophia | $146,200 | -- | |
| Littlejohn Sophia | $146,200 | -- | |
| Littlejohn Margaret E | $117,000 | -- | |
| Powell James | -- | -- |
Source: Public Records
Mortgage History
| Date | Status | Borrower | Loan Amount |
|---|---|---|---|
| Open | Littlejohn Sophia | $116,960 | |
| Previous Owner | Littlejohn Sophia | $116,960 |
Source: Public Records
Tax History
| Year | Tax Paid | Tax Assessment Tax Assessment Total Assessment is a certain percentage of the fair market value that is determined by local assessors to be the total taxable value of land and additions on the property. | Land | Improvement |
|---|---|---|---|---|
| 2025 | $3,900 | $248,100 | -- | -- |
| 2024 | $3,900 | $235,600 | -- | -- |
| 2023 | $3,713 | $223,100 | $60,000 | $163,100 |
| 2022 | $2,315 | $208,200 | $0 | $0 |
| 2021 | $6,762 | $193,300 | $0 | $0 |
| 2020 | $6,098 | $178,400 | $45,000 | $133,400 |
| 2019 | $2,937 | $170,867 | $0 | $0 |
| 2018 | $2,377 | $163,333 | $0 | $0 |
| 2017 | $2,479 | $155,800 | $0 | $0 |
| 2016 | -- | $140,033 | $0 | $0 |
| 2015 | $2,602 | $124,267 | $0 | $0 |
| 2014 | $2,602 | $108,500 | $0 | $0 |
Source: Public Records
Map
Nearby Homes
- 4108 Vine St
- 4213 Will St
- 4104 Byers St
- 4201 Torque St
- 3904 Alton St
- 4203 Shell St
- 4312 Vine St
- 3905 Byers St
- 1825 Nova Ave
- 4308 Alton St
- 4305 Byers St
- 4320 Burns St SE
- 4308 Byers St
- 4238 Southern Ave SE
- 4227 Nash St SE
- 4304 Alabama Ave SE
- 4213 Fort Dupont Terrace SE
- 4224 Southern Ave SE
- 4308 Alabama Ave SE
- 921 Ridge Rd SE
Your Personal Tour Guide
Ask me questions while you tour the home.